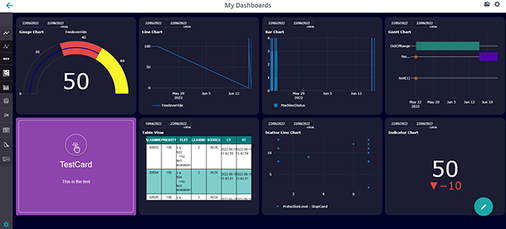
Results
Setting the dashboard display
You can change the position, the size and the display area of the charts on the dashboard display.
Icons and buttons
|
Parameters |
Description |
|---|---|
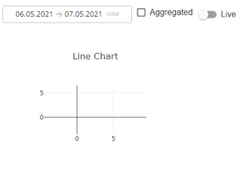
 |
Displays the time range and the time zone used. |
|
Aggregated |
Displays the aggregated data |
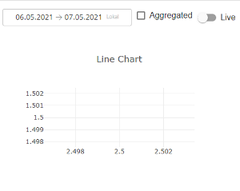
|
Live |
Displays the refreshed data starting at the time of activation. |
 |
Creates a snapshot in the "png" format. |
 |
Activates the "Zoom" function. |
 |
Activates the "Shift" of the display area function. |
 |
Zooms into the display area. |
 |
Zooms out of the display area. |
 |
Resets the complete display area |
 |
Resets the axis view |
 |
Switches over to a dotted line. |
 |
Displays the data when moving the mouse over the selected point in the chart. |
 |
Compares the data when moving the mouse over the selected point in the chart. |
 |
Connects to the plotly.com web page More information about third-party web pages is provided in Chapter: About this documentation. |
Procedure
Rearranging charts
-
The charts can only be rearranged in the edit mode.
Click on the pen icon at the lower right. The edit mode is started. -
Click on the chart that you wish to reposition on "My Dashboards".
-
Drag & drop it at the required position. You can arrange all charts in any sequence.
Changing the size of a chart
-
The chart size can only be changed in the edit mode.
Click on the pen icon at the lower right. The edit mode is started. -
Click on the zoom magnifying glass icon in the chart menu bar.
-
Move the mouse to one edge of the chart until the mouse pointer changes to an arrow with two points.
-
Stretch the window to the required size
Dark Mode
-
Open the setting menu using the "Tool" icon.
-
Select the "Dark Mode". The background becomes dark and the writing light.
Changing the display area
-
To display the menu bar, move the mouse cursor over the chart.
-
Click on "+" icon to zoom into the display area.
- OR -
-
Press and hold the left mouse button, and use the mouse to zoom into the required display area.
-
Click on "-" in the bar to zoom out of the display area.
- OR -
-
Press and hold the left mouse button, and use the mouse to zoom out of the required display area.
-
Setting the time range
You can set the time range for individual charts or for all charts at one tab.
-
Click on the time range in an individual chart. Only set the time range for this chart.
-
Click on the calendar icon at the top right. Set the time range for all charts at the tab.
-
You can set a time period of 90 days.
-
Select one of the upper entries to select a relative time period.
-
Today
-
Yesterday
-
Last 7 Days
-
Last 30 Days
-
This Month
-
Last Month
- OR -
-
-
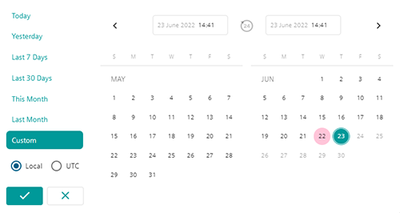
Click on "Custom" to select an absolute time period. The calendar opens.
-
Select the time zone, "Local" or "UTC".
-
Select a start and end date in the calendar.
-
-
Confirm using the checkmark button.