Results
Overview
The "Machine dashboard" view shows information about each CNC type.
The machine status, NC program status as well as the operating mode can be simultaneously displayed.
Parameters
Displaying machine data
|
Parameters |
Description |
|
|---|---|---|
 |
Displays the status of the machine:
|
|
 |
|
|
 |
|
|
|
Machine status |
To the left of the machine information, you will see a bar that displays the machine status, color-coded. When passing over with the mouse, a tooltip is displayed showing some information:
More information about machine statuses can be found in this Chapter: Machine overview. |
|
|
Name: |
Shows the machine name. |
|
|
State |
||
|
NC program |
Displays the selected NC program. |
|
|
NC program status |
Displays the last value of the NC program status. You can find more information in the following paragraph "NC program status". |
The data is displayed as a bar chart in the right-hand section of the window. |
|
Operating mode |
Displays the last value of the machine tool operating modes. |
The data is displayed as a bar chart in the right-hand section of the window. |
|
Access protection level |
The access to functions and data areas is controlled via the access rights. Access levels 0 to 7 are available, where 0 represents the highest level and 7 the lowest level. Access levels 0 to 3 are locked via a password and access levels 4 to 7 via a key switch.
|
|
|
Stop condition |
Displays the "StopCondition" NC variable that describes the cause of the NC program stop in more detail. |
|
|
Time of the last value change |
Displays the date and time of the last recording. |
|
|
Spindle override |
Displays the last value of the spindle override in percent. |
|
|
Feedrate override |
Displays the last value of the feedrate override in percent. |
|
|
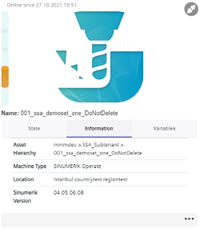
Information |
||
|
Asset hierarchy |
Displays the path. |
|
|
Machine type |
Displays the machine type or the operating software. |
|
|
Location |
Displays the location. |
|
|
SINUMERIK version |
Displays the operating software version. |
|
 |
Switching to other windows:
|
|
 |
Collapses the machine information display. |
|
 |
Expands the machine information display. |
|
|
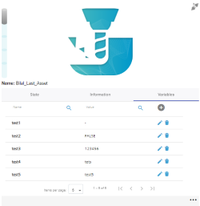
Variables |
||
|
Name |
Shows the names of the variables |
|
|
Value |
Shows the value of the variables. |
|
 |
Activates the search for names or the value of a variable. |
|
 |
Adds a new variable. Enter a name and a value for the new variable (it is not permissible that fields are left empty). If the asset already has 5 or more configured variables, the "+" icon is deactivated. |
|
 |
Saves the newly added variable. |
|
 |
Activates text box "Value" of the selected variable for editing. |
|
 |
Deletes the selected variable. |
|
 |
Interrupts editing. |
|
 |
Saves what has been edited. |
|
|
Display |
Description |
|---|---|
 |
Displays the number of active alarms. |
 |
Shows the selected time period. Opens the calendar function to set the time period. |
|
Status of the remote session |
|
|
There is no online status check when starting a remote session via MMM Overview and MMM Dashboard. The IPC use cases do not have online status information. |
|
|
|
You have no rights to start the remote session.
- OR - Manage MyMachines /Remote is not activated.
|
|
|
You can start a new remote session. |
|
|
You can join an existing remote session. |
|
Status summary |
Displays the machine information as bar chart:
|
|
|
|
|
|
More information is provided in Chapter: Status summary |
|
 |
Opens the drop-down list. |
 |
Closes the drop-down list. |
|
Pending alarms |
Displays the pending alarms. |


NOTE
Independent of the time zone settings, all variables are displayed with a UTC time stamp.
Procedure
-
Click in the machine overview on the underscored name of the required machine.
-
Window "Machine Dashboard", tab "Status" opens displaying additional machine data.
All machine information is displayed in bar charts in the right-hand section of the window.
Using the slider bar, you can scroll backwards and forwards in the lateral scroll bar.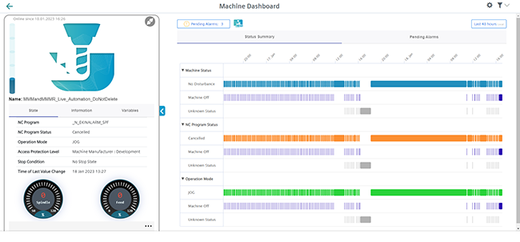
-
You obtain more information about the machine if you open tab "Information".
-
You obtain an overview of the variables configured for the machine if you open tab "Variables".
-
Click on the "+" icon to add a new variable.
-
Click on the "Recycle bin" icon to delete a variable.
-
Click on the "Edit" icon to edit the value of a variable.
To edit variables, you need the user role mmm.admin
You cannot create empty variables.
The following names are blocked and may not be assigned:
-
id
-
name
-
description
-
tenant
-
etag
-
scope
-
properties
-
propertySets
-
extends
-
variables
-
aspects
-
parentTypeId
-
timezone
-
type
-
parent
When the configuration is copied, the following applies:
-
If a variable already exists in the target asset, the variable in the target asset is retained.
-
If the variable does not exist yet, it will be added in the target asset.
For more information on copying configurations, see Chapter Copying configurations.
-
-
To collapse the machine description, click on the left-pointing arrow symbol on the right side of the frame.
The bar chart is displayed in the full-screen mode.
If the machine description is collapsed, the color display of the machine status remains at the left-hand edge of the window.
To exit the full-screen mode, click on the right-pointing arrow symbol on the left-hand edge of the window.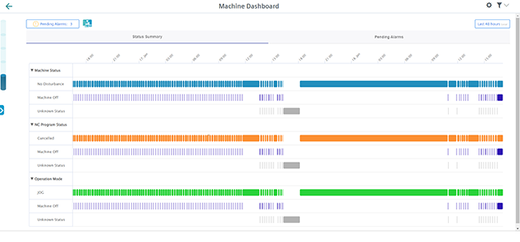
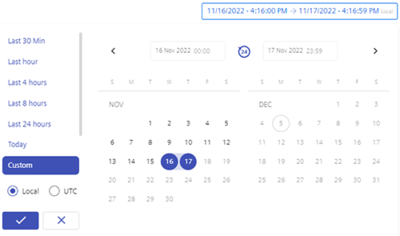
Setting the time range
You can set a time period of up to 2 days.
-
Click on the set time range. The calendar view opens.
-
You can select either a relative or an absolute time period.
-
Select one of the entries to select a relative time period.
-
Last 30 minutes
-
Last hour
-
Last 4 hours
-
Last 8 hours
-
Last 24 hours
-
Today
-
Last 48 hours
Click on "Custom" to select an absolute time period.
-
Select the time zone, "Local" or "UTC".
-
Select a start and end date in the calendar.
-
-
Confirm using the checkmark button.
Displaying details
You have the option of viewing more data in the following tabs:
NOTE
The aspect of the machine status shown shows the status for channel 1