Results
Editing charts
You can edit the individual charts and change parameters.
Parameters and icons
|
Icon |
Description |
|---|---|
 |
The "Pen" icon activates the edit menu. |
 |
The floppy disk icon exits the edit menu. |
 |
The "Tool" icon opens the menu for graphic chart layout and tab editing:
|
 |
Opens the chart menu to select additional aspects and variables. |
 |
Opens the chart menu to set the filter. |
 |
Deletes the chart. |
|
Grid Options |
|
|
Grid Options |
Displays the parameters for the grid:
You can define up to 4 rows and 12 columns. |
Procedure
To activate the edit mode in the "My Dashboards" window, click on the "Pen" icon in the lower right part of the window.
Edit the individual charts using the icons in the chart window.
Additional options are provided in Chapter Setting the dashboard display.
Changing aspects and variables
-
In the chart, click on the "Pen" icon at the lower right.
The chart menu opens. -
Open the drop-down lists "Aspect" and "Variables". Change the required parameters.
To confirm your selection, click on "Next".More information is provided in Chapter: Generating charts
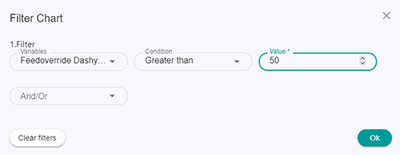
Filtering
-
In the chart, click on the "Filter" icon.
The filter menu opens. -
Select the required variable.
-
Set the condition for the value of the variables.
Use "And/Or" to logically link 2 conditions. -
Only the values within this value range are displayed in the chart.
Changing the time range
-
At the top left in the chart, click on the time range display. Enter another time range.
-
More information on the calendar is provided in Chapter: Setting the dashboard display
Deleting a chart
To delete the chart, click on the "Recycle bin" icon at the bottom right in the chart.