Results
- Manage MyMachines, Manage MyMachines /Spindle Monitor
- Introduction
- Security instructions
- Setting up the SINUMERIK control system for Manage MyMachines
- Integrating Insights Hub
- Activating data acquisition with Machine Agent
- Logging in to Insights Hub
- Using the Machine Agent
- Icons and buttons in Insights Hub
- Managing users
- Asset Manager
- Shopfloor Management Application
- Connecting controls with Insights Hub
- Configuring an alarm message and sending by email
- Displaying uploaded files in "Insights Hub Monitor"
- Machine agent
- Setting up MindConnect Nano for Manage MyMachines
- SINUMERIK Integrate Gateway
- Working with Manage MyMachines
- Overview
- Selecting a language
- Using the calendar function
- Configuring a machine overview
- Filtering machines
- Machine overview
- Filtering according to static variables
- Dashboard
- Displaying machine alarms
- Aspects
- Comparing machines
- Machine status
- Events
- Exporting
- My Dashboards
- Manage MyMachines /Spindle Monitor
- Machine location
- Motor temperature
- Files
- Machine snapshot
- Generating the identSNAPSHOT file on the SINUMERIK controller
- Remote sessions with Manage MyMachines
- Disconnecting controls from Insights Hub
- Troubleshooting when onboarding
- SINUMERIK controls
- Preconditions
- Checking the network configuration
- Checking that SINUMERIK Integrate has been enabled
- Checking that SINUMERIK Integrate has been activated
- Checking proxy settings
- Checking the SINUMERIK Integrate URL
- Checking the network connection
- Checking directory "boot_job"
- Checking the asset type in Insights Hub
- Checking the existence of onboard.key
- Resolving known faults
- More information
- Preconditions
- Machine Agent
- SINUMERIK controls
- Secure product disposal
- Appendix
- Glossary
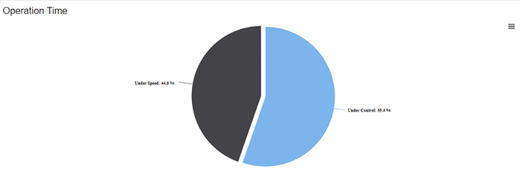
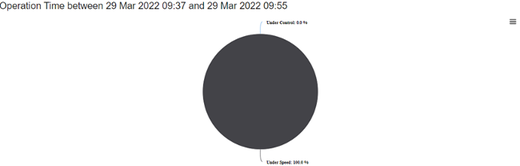
Display of the operating time
The runtime diagram shows the ratio of measured runtime under control and the measured runtime under speed.
If the operating time of the spindle under speed was exactly as long as it was under control, the time shares are displayed
with 50% respectively.
Chap. 7.16.7