Results
Aspects
User-defined aspects combine your selected data for a meaningful analysis.
All aspects are displayed in an overview. You can influence the view by applying different filter criteria.
For the individual parameters of an asset, you can create queries manually or controlled by variables.
Precondition
The configuration of the variables must be activated in the Manage MyMachines for Industrial Operations X Cloud "Shopfloor Management Application".
More information is provided in Chapter: Overview.
Parameters and buttons
The following aspects are displayed as default setting. You also have the option of configuring your own aspects.
You can display variable data as diagram (diagram variables) or in a tabular form (table variables).
In the tabular view you can sort the data either alphabetically or numerically (either in ascending or descending order).
|
Parameters |
Description |
|
|---|---|---|
|
SpindleMonitorConfig |
The following data is displayed:
|
|
|
AgentOnlineStatus |
The following data is displayed:
|
|
|
Alarms |
The following data is displayed:
|
|
|
CH1_BasicConfig |
SINUMERIK basic configuration The following data is displayed:
|
|
|
CH1_MachineStatus |
Time of the machine status in the selected time period. The machine status is displayed numerically: |
|
|
0 |
Unknown status |
|
|
1 |
Production |
|
|
2 |
Technical Disturbance |
|
|
3 |
Organizational Disturbance |
|
|
4 |
No Disturbance |
|
|
MachineModel |
The following data is displayed:
|
|
|
Startup |
The following data is displayed:
|
|
|
Mode |
Description |
|---|---|
|
Aggregate mode |
Displays the first and last value, sorted according to units. |
|
Unprocessed mode |
Displays the last 256 values. |
|
Automatic mode |
Automatically switches between the two modes depending on the time range. |
|
Button |
Description |
|---|---|
 |
Displays the time range and the time zone used. Opens the calendar function. |
 |
Opens the detailed view of the data. |
 |
Closes the detailed view of the data. |
Procedure
-
In the "Information" area, click on the button with dots.
-
Click on "Aspects".
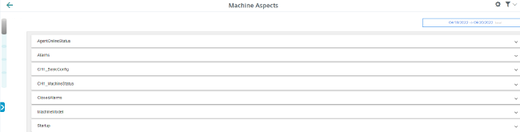
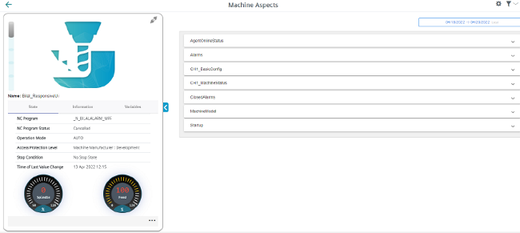
The "Machine Aspects" window opens. -
The machine description is shown in the left-hand section of the window.
-
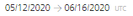
In the right-hand section of the window, select the time range using the calendar function.
More information is provided in Chapter: Using the calendar function -
To see the data recording, right-click on button
.
-
To collapse the machine description, click on the left-pointing arrow symbol on the right side of the frame.
The bar chart is displayed in the full-screen mode.