Results
Generating charts
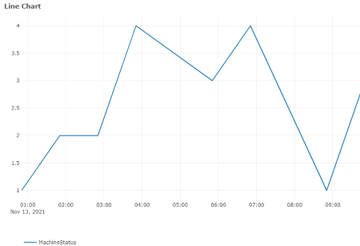
Using the "My Dashboards" function, you can create and edit line, bar, indicator and Gantt charts as well as table overviews.
Icons and buttons
|
Parameters |
Description |
|
|---|---|---|
 |
The "Gear wheel" icon opens the menu for graphic chart layout and tab editing:
|
|
|
Chart type |
||
 |
The "Line Charts" icon opens all available line charts. |
|
 |
Opens the menu for creating a line chart. |
|
 |
||
 |
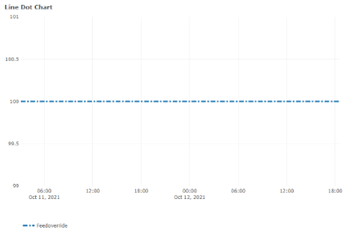
Opens the menu for creating a line dot chart. |
|
 |
||
 |
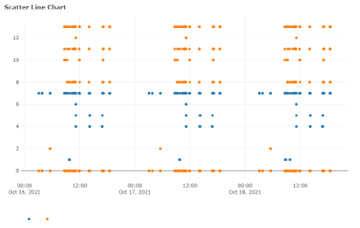
Opens the menu for creating a scatter line chart. |
|
 |
||
 |
Opens the menu for creating a filled line chart. |
|
 |
||
 |
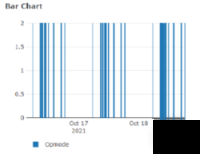
Opens the menu for creating a bar chart. |
|
 |
||
 |
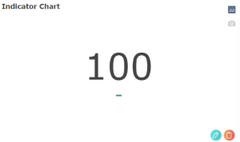
The "Indicator Charts" icon opens all available indicator charts. |
|
 |
Opens the menu for creating an indicator chart. |
|
 |
||
 |
Opens the menu for creating a gauge chart. |
|
 |
||
 |
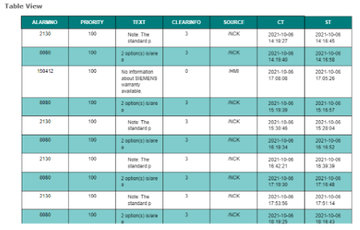
Opens the menu for creating a table overview. |
|
 |
||
 |
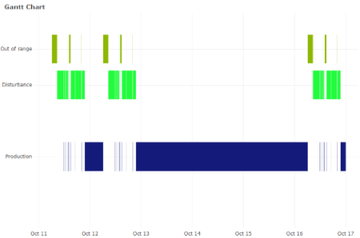
Opens the menu for creating a Gantt chart. |
|
 |
||
 |
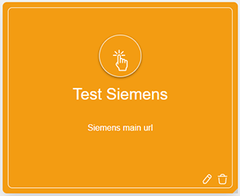
Opens the menu to create a card with a link. |
|
 |
||
|
Parameters and functions |
||
|
New Chart |
||
|
Asset |
Displays the asset selected in the machine overview. |
|
|
Aspect |
Opens the drop-down list with the predefined aspects. |
|
|
Variables |
Opens the drop-down list with the predefined variables. |
|
|
Add ... |
Confirms and supplements the selected aspects and variables. |
|
|
Create a New KPI |
Opens the menu for creating a new KPI:
Number of variables per KPI: |
|
 |
Deletes the selected parameter. The respective check box must be deactivated. |
|
 |
Adds a new value range or task to line charts, gauge charts and Gantt charts. |
|
 |
Deletes the value ranges or tasks in line charts, gauge charts and Gantt charts. |
|
|
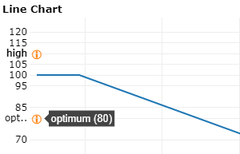
Label |
The value of the label is entered in the chart and marked using a horizontal line. The name is displayed when the mouse hovers over the icon. |
|
 |
||
|
Date Time Range |
||
 |
Opens the calendar function to define a time period. More information can be found in Chapter Setting the dashboard display. |
|
|
Chart name (optional) |
Provides the option of entering a chart name. |
|
Procedure
-
Move the mouse onto the bar at the lefthand edge of the window. The bar with the edit icons is pulled down.
-
Click on "Line Charts" or "Indicator Charts". Additional edit icons are displayed.
-
Click on the required chart type to create a new chart.
-
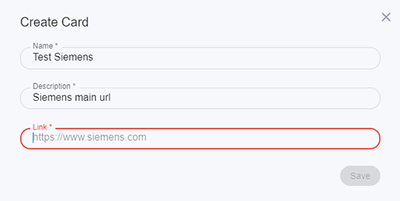
For "Card", a window opens to enter a name, description and URL.
-
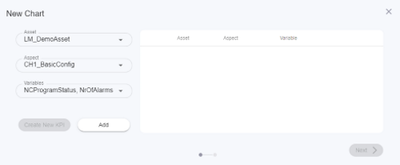
For all other chart types, the window opens to select the aspect and variables.
The name of the asset that you selected is automatically displayed in the "Asset" field.-
Select the required entry from the "Aspect" drop-down list.
-
Select the required options from the "Variables" drop-down list.
-
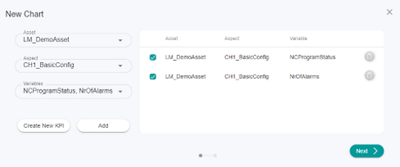
Click on "Add".
-
-
The selection is displayed.
Activate the required check box and click the "Next" button.
-
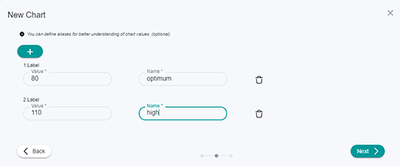
For line charts and bar charts, a dialog is displayed to specify a label.
-
Click on the "+" icon to create a new label.
-
Enter the label name.
-
Enter the value.
-
Click on "Next".
-
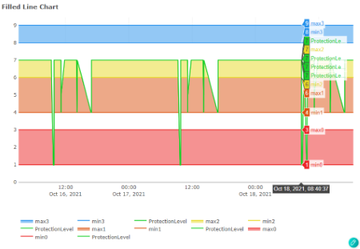
-
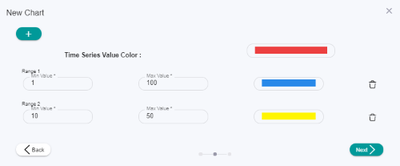
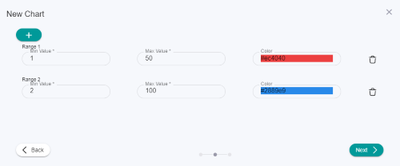
The following window opens for the "Filled Line Chart":
-
Click the "+" icon to create a new value range.
-
Click in the Color text box to select a color.
-
Click on "Next".
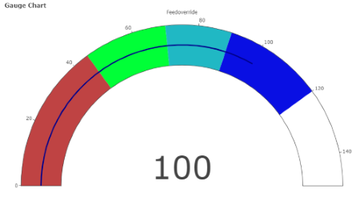
The following window opens for the "Gauge Chart":
-
Click the "+" icon to create a new value range.
-
Click in the Color text box to select a color.
-
Click on "Next".
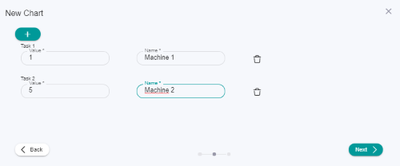
The following window opens for the "Gantt Chart":
-
Enter a value and a machine name.
-
Click on the "+" icon to enter another value and device name.
-
Click on "Next".
-
-
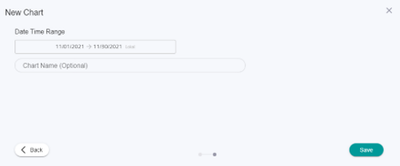
The "Date Time Range" window opens.
-
To open the calendar, click on the time range display.
-
Select a time period.
-
Optionally enter a chart name in the "Chart Name" text box.
Click on "Save" in the lower right part of the window. You return to the "My Dashboards" window.
-