Results
Machine overview
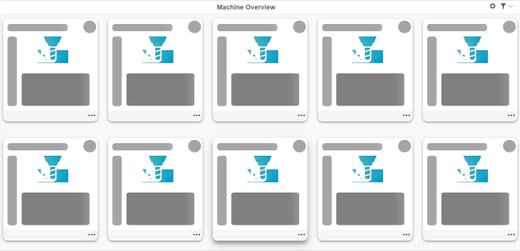
When you open Manage MyMachines for Industrial Operations X Cloud "Manage MyMachines", the "Machine Overview" window opens and all of the available machines are listed together with the associated data.
Parameters
|
Description |
|
|---|---|
|
Underlined asset name |
Displays the machine names By clicking on the underscored machine name, the "Machine Dashboard" window opens and additional machine information is displayed. |
 |
Displays the status of the machine:
|
 |
|
 |
|
|
Status of the remote session |
|
 |
|
 |
You can start a new remote session |
 |
You can join an existing remote session |
|
Note: There is no online status check when starting a remote session via MMM Machine Overview and MMM Dashboard. Please note that the IPC use cases do not have online status information. |
|
|
Machine status |
|
|
To the left of the machine information, you will see a bar that displays the machine status, color-coded. When passing over with the mouse, a tooltip is displayed showing some information: |
|
|
The machine status is not known if one of the following reasons exists:
|
|
The operating mode is "AUTO", none of the stop conditions listed below apply, and the following situation exists:
|
|
The machine status displays "Technical Disturbance". The operating mode is "AUTO", and one of the following stop conditions is active:
|
|
The machine status displays "Organizational Disturbance". No other disturbances or conditions occur than are described under "Tech. Disturbance". |
|
The operating mode is not "AUTO". |
|
Information about the machine |
|
|
Alarms |
Displays the number of active alarms. Window "Machine alarms" opens if you click on the underlined data. More information is provided in Chapter: Displaying machine alarms. |
|
HMI-UI type |
Displays the operating software:
|
|
Location |
Time at the machine location |
|
NC program |
Displays the NC program |
|
Tenant ID |
Displays the customer name. |
 |
Opens an additional window:
|
Procedure
-
In the launch pad, click on the "Manage MyMachines" icon.

-
The "Machine Overview" window opens.
-
The machines are loaded depending on the resolution of the screen and the degree of scaling of the settings in the web browser. Scroll down to display all of the machines.
-
You see a skeleton list view when loading data.
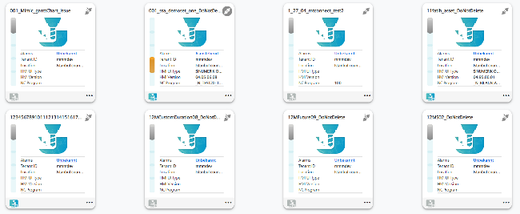
The available machines are displayed as soon as the data has been loaded.
-
-
Click on the required machine.
The "Machine Dashboard" window opens and you can view additional data.
More information is provided in Chapter: Dashboard.
NOTE
Machines connected to the SINUMERIK Integrate Gateway interface are displayed as being online. To do this, for at least one aspect of the particular machine, data should be uploaded in a time interval of less than five minutes. If this is not the case, then the machine can appear offline.