Results
- Manage MyMachines, Manage MyMachines /Spindle Monitor
- Introduction
- Security instructions
- Setting up the SINUMERIK control system for Manage MyMachines
- Integrating Insights Hub
- Activating data acquisition with Machine Agent
- Logging in to Insights Hub
- Using the Machine Agent
- Icons and buttons in Insights Hub
- Managing users
- Asset Manager
- Shopfloor Management Application
- Connecting controls with Insights Hub
- Configuring an alarm message and sending by email
- Displaying uploaded files in "Insights Hub Monitor"
- Machine agent
- Setting up MindConnect Nano for Manage MyMachines
- SINUMERIK Integrate Gateway
- Working with Manage MyMachines
- Overview
- Selecting a language
- Using the calendar function
- Configuring a machine overview
- Filtering machines
- Machine overview
- Filtering according to static variables
- Dashboard
- Displaying machine alarms
- Aspects
- Comparing machines
- Machine status
- Events
- Exporting
- My Dashboards
- Manage MyMachines /Spindle Monitor
- Machine location
- Motor temperature
- Files
- Machine snapshot
- Generating the identSNAPSHOT file on the SINUMERIK controller
- Remote sessions with Manage MyMachines
- Disconnecting controls from Insights Hub
- Troubleshooting when onboarding
- SINUMERIK controls
- Preconditions
- Checking the network configuration
- Checking that SINUMERIK Integrate has been enabled
- Checking that SINUMERIK Integrate has been activated
- Checking proxy settings
- Checking the SINUMERIK Integrate URL
- Checking the network connection
- Checking directory "boot_job"
- Checking the asset type in Insights Hub
- Checking the existence of onboard.key
- Resolving known faults
- More information
- Preconditions
- Machine Agent
- SINUMERIK controls
- Secure product disposal
- Appendix
- Glossary
Pending alarms
For the selected SINUMERIK control system, the "Machine Dashboard" view > "Pending Alarms" tab provides an overview of the alarms for a defined time interval.
Parameters
|
Parameters |
Description |
|
|---|---|---|
|
Type |
Displays the following icons: |
|
 |
Notice |
|
 |
Note |
|
|
ID |
Displays the alarm identifier. |
|
|
Alarm text |
Displays an alarm description. |
|
|
Start time |
Shows the start time with the date YYYY-MM-DD and time hh:mm:ss |
|
|
Duration |
Displays the alarm duration in days and hours. |
|
Procedure
-
In the right-hand section of the window, open tab "Pending Alarms".
The details of the pending alarms are displayed.
In the right-hand section of the window, use the slider bar to scroll up and down in the lateral scroll bar.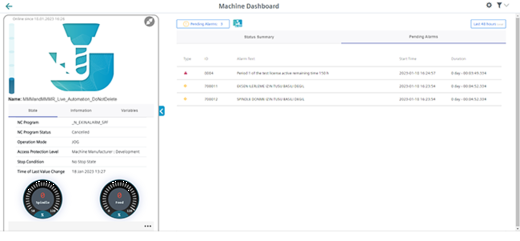
Chap. 7.8.2