Results
Service Dashboard
Precondition
You require admin rights to use the "Service Dashboard" function.
Parameters
|
Parameter/icon |
Description |
|---|---|
 |
Opens the "Manage MyMachines /Remote" start page. |
 |
Displays the time range and the time zone used. By default, the time range is set to "Last 7 days". More information can be found in Chapter: Using the calendar function. |
|
Export PDF |
Exports the "Service Dashboard" data in the time range used to a PDF file. |
Procedure
-
Click on the "Service Dashboard" button.
-
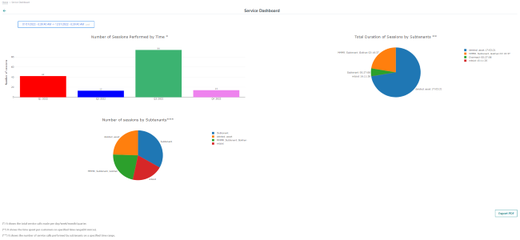
The "Service Dashboard" window opens.
-
The "Number of sessions performed by time" bar chart shows you the total number of service calls per day/week/month/quarter.
-
The "Total duration of sessions by subtenants" pie chart shows you the time spent per customer in a certain period of time (hh:mm:ss).
-
The "Number of sessions by subtenants" pie chart shows you the number of service calls per customer.
Hover the mouse over the diagrams to display the underlying data in detail.
-
-
To make time range settings in the time range, click in the upper left of the time range window.
-
Click "Export PDF" to export the displayed data of the window to a PDF file.
The "Print" window opens.
To save the PDF file, click "Save"
- OR -
To cancel the operation, click "Cancel".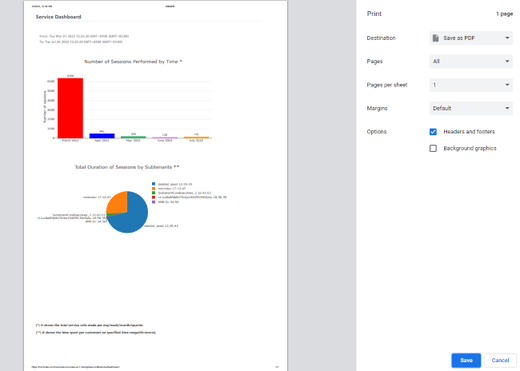
-
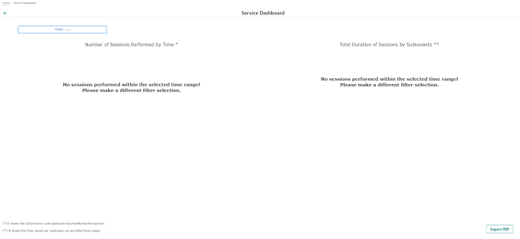
If no session was held in the selected time range, the following message is displayed:
"No sessions performed within the selected time range! Please make a different filter selection."