Results
Triggering Alarms for Disturbances
The Triggering Alarms for Disturbances page offers a graphical and a list view of technical disturbances and NC stops, which occurred at the control 60 seconds ago and lasted for antother 60 seconds.
Setting up a graph
To set up a graph proceed as follows:
-
Click on the graph icon, if not already activated.

-
Select a date range in the drop down menu "Selected Date Range".
-
Select either tab "Techn. Disturbances" or "Alarm Reaction / NC Stop".
A graph shows which technical disturbances or NC stops occurred at the control in the selected date range.
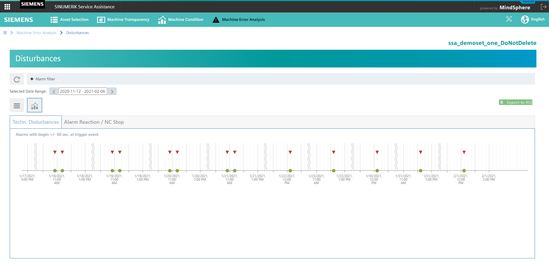
Disturbances Graph
You can zoom in and out of the graph by marking a rectangular area with the mouse.
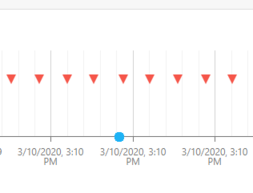
Table of values
-
Click on the table icon, if not already activated.

A table shows detailed information on the technical disturbances or NC stops, i.e. alarm number or source. Furthermore it is possible to export the table to an excel file (*.xls) by clicking the button "Export to XLS".
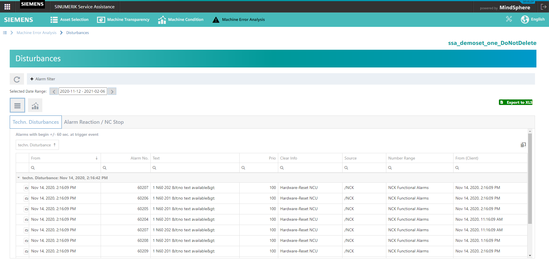 Disturbances List
Filtering for disturbances
-
Click on button "Alarm Filter".
-
Select a source for the alarm.
-
Type in a search parameter either for "Number Range", "Clear Info", "Text" or "Alarm Number".
-
Click on "Execute Filter".
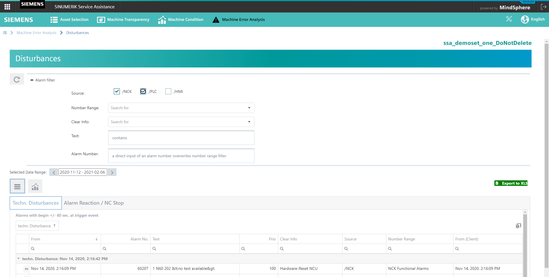
Disturbances Filter