Results
Process Data
The Process Data page offers a graphical view of variables of the controller over a certain period.
Setting up a graph
To set up a graph proceed as follows:
-
Select a time range in the drop down menu "Selected Time Range".
-
Select one or several units (maximum three units).
-
Select one or several Aspects. One Aspect may consist of several variables itself.
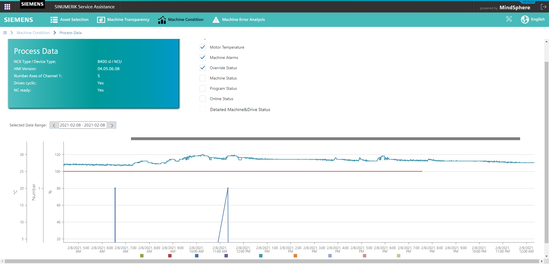
Process Data
The constructed graph shows the change of the variables over the selected time range. You can zoom in and out of the graph by marking a rectangular area with the mouse.
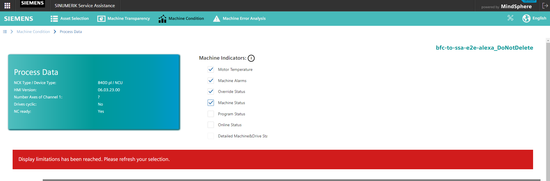
Machine indicators
NOTE
To learn more about the meaning of variables, click on the trademark symbol (i button).
|
Indicators |
Variables |
|---|---|
|
Motor Temperature |
AX01_Motor_Temp…..SP01_Motor_Temp |
|
Machine Alarms |
NrOfAlarms |
|
Override Status |
Feedoverride |
|
Spindleoverride |
|
|
Machine Status |
MachineStatus |
|
Program Status |
NCProgramStatus |
|
OpMode |
|
|
ProtectionLevel |
|
|
StopCond |
|
|
Online Status |
OnlineStatus |
If you reach the limitation of indicator selection, you will see the following warning:
Units of aspects
The units of aspects are listed the following table:
|
Aspects |
Variables |
Units |
|
Basic Configuration |
Feedoverride |
% |
|
Spindleoverride |
% |
|
|
NCProgramStatus |
One |
|
|
Opmode |
One |
|
|
ProtectionLevel |
One |
|
|
StopCond |
One |
|
|
NrOfAlarms |
Number |
|
|
Machine Status |
MachineStatus |
One |
|
Online Status |
onlineStatus |
boolean |
|
CSM_General_Info |
All variables |
One |
|
CSM_AX/SP |
Drives_Status |
One |
|
Motor_Temp |
°C |
|
|
ImpulseEnable_PLC |
One |
|
|
ControlConfirmActive_NC |
One |
NOTE
Please note, that if you select 30 days as time range, there will be a note to use a smaller date range (max. 7 days).