Results
Boot Monitoring
The Boot Monitoring page offers a graphical and a list overview of boot events over a certain period.
Setting up a graph
To set up a graph proceed as follows:
-
Click on the graph icon, if not already activated.

-
Select a time range in the drop down menu "Selected Time Range".
A graph shows how many times a certain boot event has occurred at the control.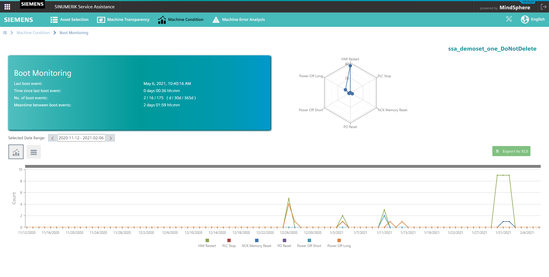 Boot Monitoring Graph
Table of values
-
Click on the table icon, if not already activated.

A table shows the exact date and time, when a certain boot event occurred at the control. It is possible to search for values in the search box above the table. Furthermore it is possible to export the table to an excel file (*.xls) by clicking the button "Export to XLS".
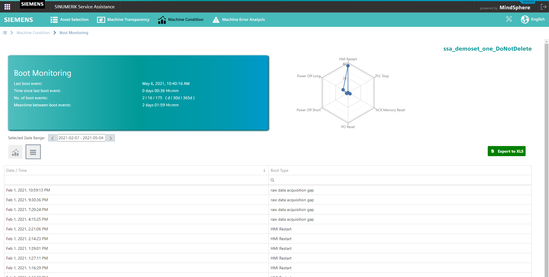 Boot Monitoring Table