Results
Operating Time
The Operating Time page offers a graphical and a list view of power on, power off and operating time of the controller over a certain period.
Setting up a graph
To set up a graph proceed as follows:
-
Click on the graph icon, if not already activated.

-
Select a time range in the drop down menu "Selected Time Range".
A graph shows how many times a user with a certain access level has used the control.
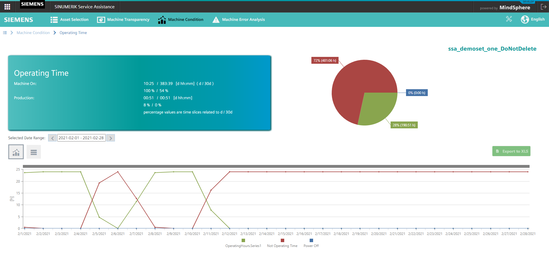
Operating Time Graph
You can zoom in and out of the graph by marking a rectangular area with the mouse.
Table of values
-
Click on the table icon, if not already activated.

The table below shows the start and the end times for power on, power off and operating time of the controller. Furthermore the duration and the machine status are shown. It is possible to search for values in the search box above the table. Furthermore it is possible to export the table to an excel file (*.xls) by clicking the button "Export to XLS".
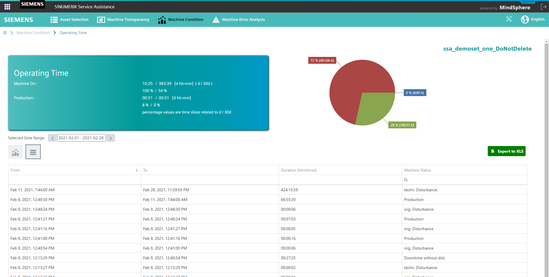 Operating Time Table