Results
Alarm History
The Alarms History page offers a graphical and a list view of historical alarms, which were active or closed at the control over a period of time.
Setting up a graph
To set up a graph proceed as follows:
-
Click on the graph icon, if not already activated.

A graph shows which alarms occurred at what time at the control.
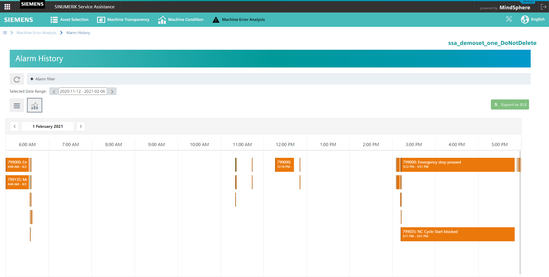 Alarm History Graph
 -
Select a time range in the drop down menu "Selected Time Range".
You can zoom in and out of the graph by marking a rectangular area with the mouse.
Table of values
-
Click on the table icon, if not already activated.

The table below shows detailed information on the historic alarms. Furthermore it is possible to export the table to an excel file (*.xls) by clicking the button "Export to XLS".
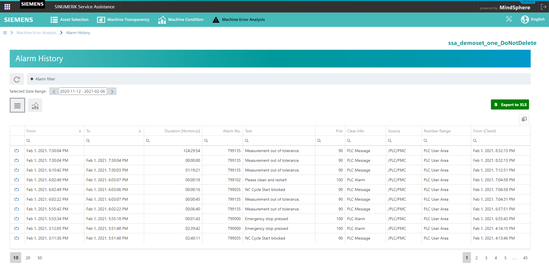 Alarm History Table
Filtering for an alarm
-
Click on button "Alarm Filter".
-
Select a source for the alarm.
-
Type in a search parameter either for "Number Range", "Clear Info", "Text" or "Alarm Number".
-
Click on "Execute Filter".
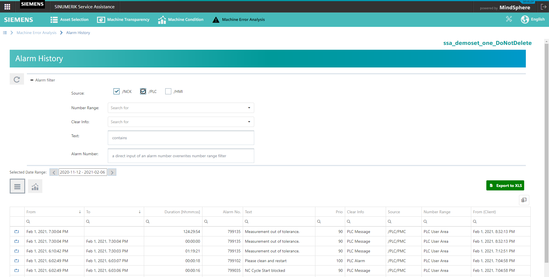
Alarm History Filter