Results
- SIMATIC Performance Insight V1.16
- Legal information
- What's new in Performance Insight?
- Introduction to Performance Insight
- Configuring types
- Setting parameters
- Parameters in Performance Insight
- Displaying a parameter list
- Displaying current values of a parameter
- Editing settings for variables
- Editing settings for KPI instances
- Saving the values of a KPI in a variable
- "Activate notifications" for variables with numerical data type and KPI instances
- "Activate notifications" for variables of the data type "Bool" and "String"
- "Counter" acquisition category
- Aggregation functions
- Presenting the productivity of a plant transparently (OEE analysis)
- Configuring a step time analysis
- Configuring multivariable regression
- Evaluating the production of individual batches
- Creating user-defined dashboards
- Creating a dashboard
- Structure of the dashboards
- Creating widgets
- Introduction to widgets
- Create a widget
- Visualizing correlations (Diagram)
- Visualizing values (Value)
- Visualizing machine statuses (Gantt)
- Visualizing the violation of limit values (gauge)
- Visualizing the distribution of consumptions or quantities (Pie chart)
- Visualizing the intensity of data values (Heatmap)
- Visualizing relationships in 3D (3D bars)
- Preview a widget
- Working with widgets
- Widget views
- Adapting a user-defined dashboard
- Exporting and importing dashboards
- Analyzing data
- Creating reports
- Appendix
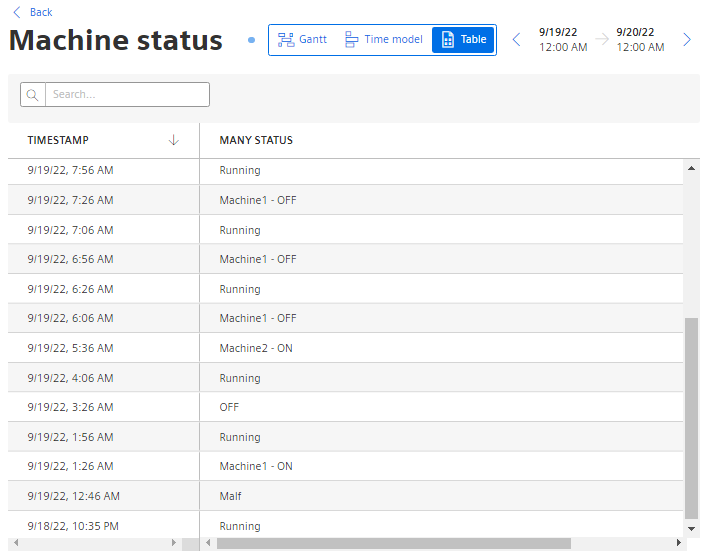
Table
Description
-
Click
 "Details" in the OEE analysis at the widget "Machine status".
The "Gantt" view is displayed.
-
Select the "Table" view.
The view shows a tabular overview of the machine states in the displayed period.
-
To display the analysis for a different time period, use the operator controls to navigate in time.
-
To filter the display, enter a string in the search field.
All machine states for which a cell contains the character string are displayed.
Example: They only show the machine state "Stopped".
-
To sort the table, click in a column header.
You can change a specification of the machine state by clicking on the entry.
Chap. 6.3.3.3