Results
KPIs
Detail view
Description
To open the detail view, click  in the OEE analysis.
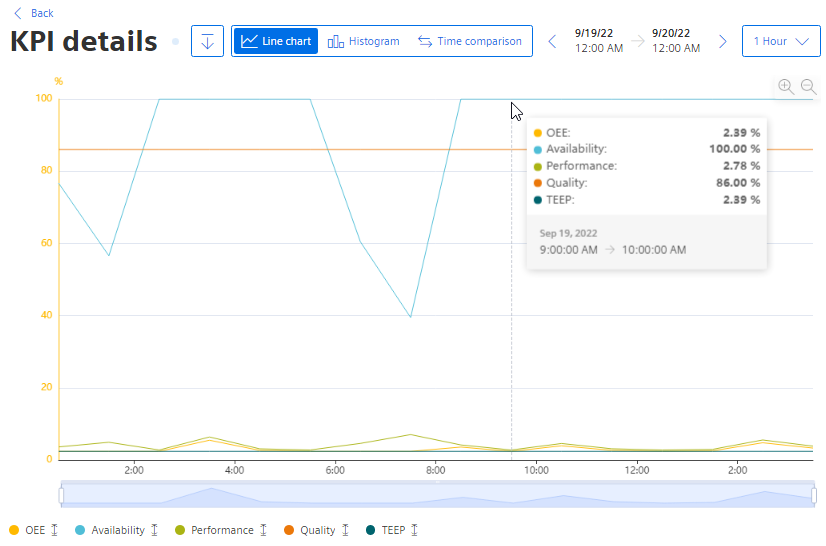
All KPIs are displayed as a diagram in the detail view.
-
To show or hide a KPI, click the KPI.
The scaling of the y axis adapts automatically.
-
To display detailed information as a tooltip, move the mouse pointer over the diagram.
-
To show or hide the limit values for a KPI, click
 .
.
-
To switch to a different view, select "Histogram" or "Time comparison".
Histogram
Description
-
Click
"Details" In the OEE analysis.
The "Diagram" view is displayed.
-
Select "Histogram" as the view.
-
Select the KPI for which the histogram is displayed.
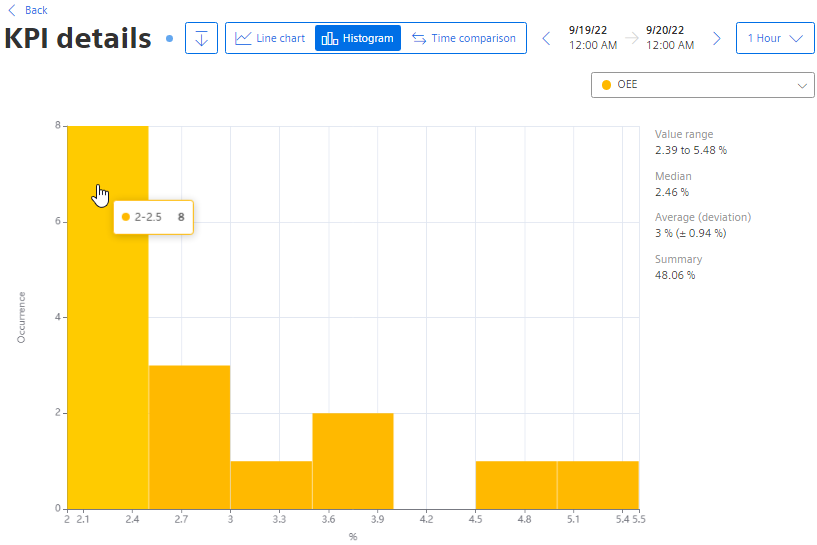
The histogram shows the history of the frequency distribution.
Time comparison
Description
-
Click
"Details" In the OEE analysis.
The "Diagram" view is displayed.
-
Select "Time comparison" as the view.
The KPIs OEE, Availability, Performance and Quality are displayed for different past periods as a bar graph.
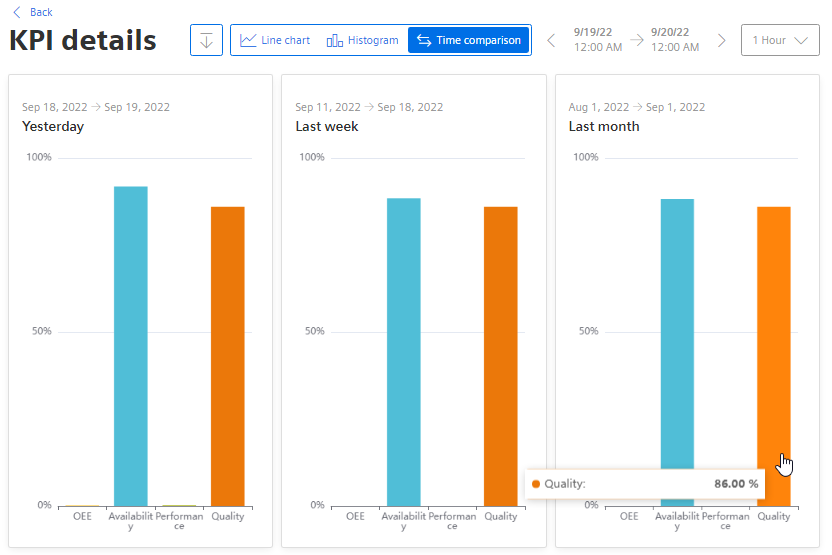
To see the exact value of a KPI, move the cursor over one of the bars.