Results
Overview of the overall equipment effectiveness (OEE)
Description
With the key performance indicator of the overall equipment effectiveness (Overall Equipment Effectiveness OEE) you calculate the productivity of a plant or its losses.
You use the automatically generated OEE dashboard to display it transparently. The overall equipment effectiveness is a measure of the added value of a system.
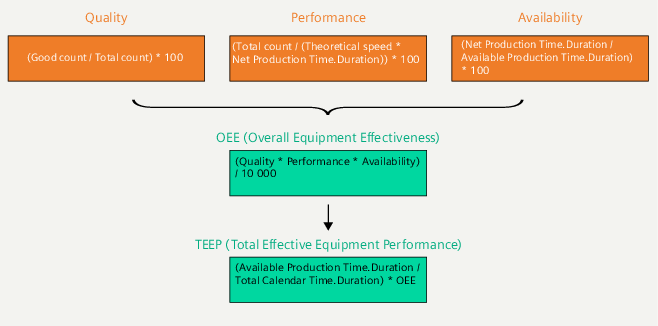
The overall equipment effectiveness is defined as the product of the following three factors:
-
Availability (e.g. whether there are fault times)
-
Performance (e .g. whether the system is running at full load or reduced load)
-
Quality (e.g. how many rejects are produced)
The range of value is between 0% and 100%.
Time model as extension of a plant status model
The time categories form the basis for the pre-defined time model. The corresponding time category can be assigned in the status mapping table. Thus, for each machine status, the time category to which the machine status belongs is defined.
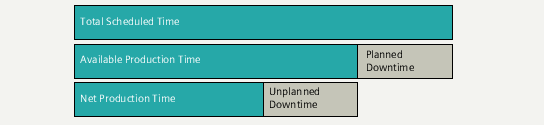
In order to calculate the key performance indicators for the overall equipment effectiveness, the following time categories are available:
-
Total Scheduled Time
The total number of hours available,
for example, 1 week = 168 hours
-
Available Production Time
The total number of hours available minus the planned downtimes,
such as breaks => 168 hours - 21 hours = 147 hours
-
Net Production Time
The number of hours available after subtracting the planned downtimes minus the unplanned downtimes,
such as malfunctions => 147 - (1.5 * 7) = 136.5 hours
-
Planned Downtime
Planned downtimes, for example, for maintenance
-
Unplanned Downtime
Unplanned downtimes, for example, due to damage or lack of resources
OEE key performance indicators
The figure below shows the structure of the key performance indicators in order to ultimately obtain a meaningful figure for the productivity of the plant:
The predefined key performance indicators (KPI types  ) are available in Performance Insight to determine the productivity of the plant. You can edit the KPI types later.
Micro-stops
The display of very short production interruptions makes the OEE analysis unclear and may skew the calculated KPIs. For example, it may be unavoidable that a machine stops for an insignificant period of time because material is not immediately available. It is usually not desirable for such micro-stops to be included in the analysis.
When configuring an OEE dashboard, you define the basis on which a micro-stop is detected:
-
Transmitted from the controller via a variable
-
Defined in milliseconds as fixed period
The configuration for micro-stops applies to an asset. A micro-stop threshold or a parameter can be defined per asset.
Downtimes detected as micro-stops are filtered out of the analysis and do not influence the calculation of the KPIs.
The dashboard displays how many micro-stops were detected and how long they lasted in total.
If you change the basis for the micro-stop (fixed period) in the OEE configuration, the KPIs are recalculated and updated.