Results
- SIMATIC Performance Insight V1.17
- Preface
- What's new?
- Get to know Performance Insight
- Configuring the Performance Insight
- Adapting the app
- Configuring types
- Setting parameters
- Parameters in Performance Insight
- Displaying a parameter list
- Displaying current values of a parameter
- Editing settings for variables
- Editing settings for KPI instances
- Saving the values of a KPI in a variable
- "Activate notifications" for variables with numerical data type and KPI instances
- "Activate notifications" for variables of the data type "Bool" and "String"
- "Counter" acquisition category
- Aggregation functions
- Operation
- Presenting the productivity of a plant transparently (OEE analysis)
- Configuring a step time analysis
- Configuring multivariable regression
- Evaluating the production of individual batches
- Creating user-defined dashboards
- Creating a dashboard
- Structure of the dashboards
- Creating widgets
- Introduction to widgets
- Create a widget
- Visualizing correlations (Diagram)
- Visualizing values (Value)
- Visualizing machine statuses (Gantt)
- Visualizing the violation of limit values (gauge)
- Visualizing the distribution of consumptions or quantities (Pie chart)
- Visualizing the intensity of data values (Heatmap)
- Visualizing relationships in 3D (3D bars)
- Linking an image for presentation
- Preview a widget
- Working with widgets
- Widget views
- Adapting a user-defined dashboard
- Exporting and importing dashboards
- Analyzing data
- Creating reports
- Quality codes
- Appendix
Displaying current values of a parameter
From the parameter list, you directly show the current values of a variable or a KPI instance. In this way, you find out whether and which values are currently available.
Procedure
To display the current values of a parameter, proceed as follows:
-
Show the parameter list.
-
Click
 for the selected parameter.
-
Select "Detail" in the drop-down menu.
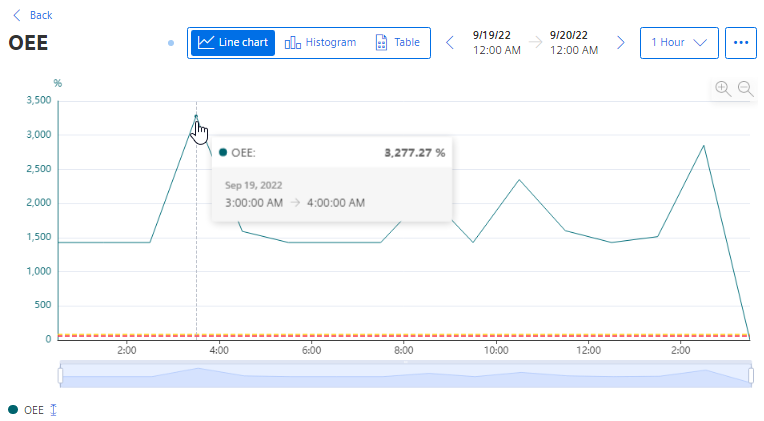
The preview of the current values is displayed.
-
To display a different period, use the navigation elements.
-
To edit the settings for the variable, click in the preview on
and select "Edit".
Alternative procedure
-
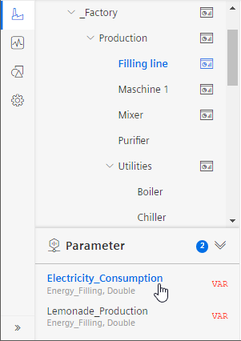
Show the parameter list below the assets and click a parameter.
The graphical preview of the parameter values is displayed.
See also
Chap. 4.3.3