Results
- SIMATIC Performance Insight V1.17
- Preface
- What's new?
- Get to know Performance Insight
- Configuring the Performance Insight
- Adapting the app
- Configuring types
- Setting parameters
- Parameters in Performance Insight
- Displaying a parameter list
- Displaying current values of a parameter
- Editing settings for variables
- Editing settings for KPI instances
- Saving the values of a KPI in a variable
- "Activate notifications" for variables with numerical data type and KPI instances
- "Activate notifications" for variables of the data type "Bool" and "String"
- "Counter" acquisition category
- Aggregation functions
- Operation
- Presenting the productivity of a plant transparently (OEE analysis)
- Configuring a step time analysis
- Configuring multivariable regression
- Evaluating the production of individual batches
- Creating user-defined dashboards
- Creating a dashboard
- Structure of the dashboards
- Creating widgets
- Introduction to widgets
- Create a widget
- Visualizing correlations (Diagram)
- Visualizing values (Value)
- Visualizing machine statuses (Gantt)
- Visualizing the violation of limit values (gauge)
- Visualizing the distribution of consumptions or quantities (Pie chart)
- Visualizing the intensity of data values (Heatmap)
- Visualizing relationships in 3D (3D bars)
- Linking an image for presentation
- Preview a widget
- Working with widgets
- Widget views
- Adapting a user-defined dashboard
- Exporting and importing dashboards
- Analyzing data
- Creating reports
- Quality codes
- Appendix
"Activate notifications" for variables with numerical data type and KPI instances
Requirement
You have selected a variable in the parameter list and opened it for editing.
Description
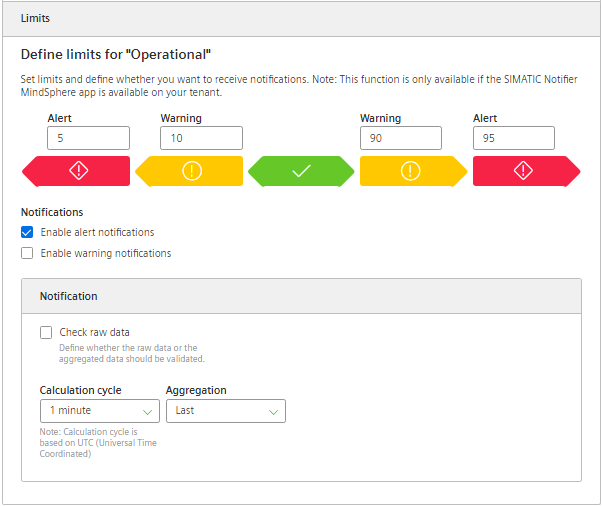
For each variable, you can define high and low limits that trigger a notification when violated. This notification is displayed in the Notifier app and sent directly to the selected mobile device.
The limits defined for the variable are applied by default in the widget as soon as the variable is used. You can adapt the limits in the widget.
Procedure
To enable the "Activate notifications" function, proceed as follows:
-
In the parameter list, open a variable for editing.
-
Go to the area "Limits".
-
Enter the upper and lower values which trigger a warning and an alarm when violated.
-
Select the check box for corresponding notifications.
-
To apply raw data, select the "Validate raw data" check box.
A fixed calculation cycle of 10 seconds is used.
-
When you use aggregated data, select the calculation cycle and the aggregation.
The calculation cycle always starts at 00:00 UTC (Universal Time Coordinated), e.g. 00:00:00; 00:15:00; etc.
The following aggregation functions are available: AUTOHOTSPOT.
Chap. 4.3.7
NOTE
The SIMATIC Notifier must be installed and running so that you can use the "Activate notifications" function.