Results
Creating a model
Description
As soon as you have created a model, an MVR dashboard is automatically created for the asset. You can create multiple models each for different input parameters.
The available models are grouped and visualized by parameter in this dashboard.
NOTE
Multivariable regression is expressed through a mathematical formula. This means only variables with numerical values (Int32, Double, etc.) are permitted as parameters.
A parameter of String type can be additionally selected, for example, to designate production sections in the visualization by a descriptive name. Only the aggregation "Last" type is available for parameters of String type.
Procedure
To create a model, follow these steps:
-
Select an asset in My Plant. The overview of the dashboards for the asset is displayed.
-
Click "Add dashboard". in the overview view of the asset.

-
Select "Multivariable regression".
The "Add multivariable regression" view is displayed.
-
Give the model a descriptive name.
Based on the name, you later select the model for visualization from the existing models on the MVR dashboard.
-
Optionally enter a description.
-
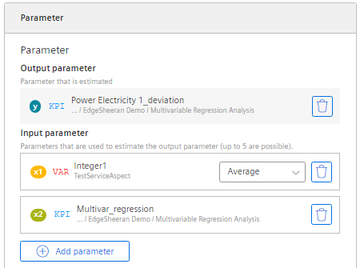
Select the output parameter.
This is the parameter whose dependency is represented by the values of the input parameters.
The output parameter can be a variable or a KPI.
-
Select the input parameters.
You can select up to 5 input parameters. These are the parameters for which you want to show how they influence the value of the output parameter.
No formula and no model without valuesNOTE
If no data is available for the selected analysis period, no formula can be calculated. You cannot save the model without a formula.
A warning shows the parameter for which there is no data.
Change the calculation period or select other parameters.
-
Select a type of aggregation for each variable.
The time stamps of the aggregated values are to be identical.
-
Define the calculation period.
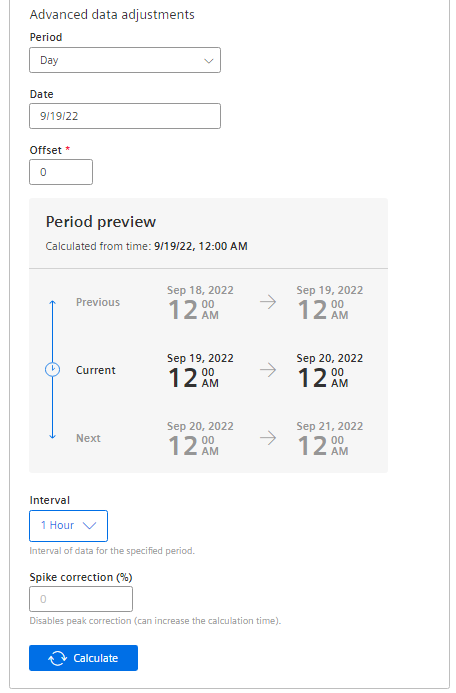
The calculation period is applied as the default in the visualization. The user can modify the calculation period on the dashboard.
-
Select the interval at which the data is acquired.
-
To ignore outliers in the analysis, enter a value for "Peak correction".
The greater this value, the smoother the considered value chart.
Values from 1% through 100% are permitted.
If you do not specify a value, the value chart is not corrected.
-
Click "Calculate".
Variables with linear dependencyNOTE
Variables are linearly dependent when the values are the same or a multiple of each other at all times.
No resources can be calculated for linearly dependent variables.
An error message is displayed when you select linearly dependent variables.
The formula that describes the interaction of the selected parameters during the selected period is calculated.
The preview of the visualization for the calculation time range is displayed.
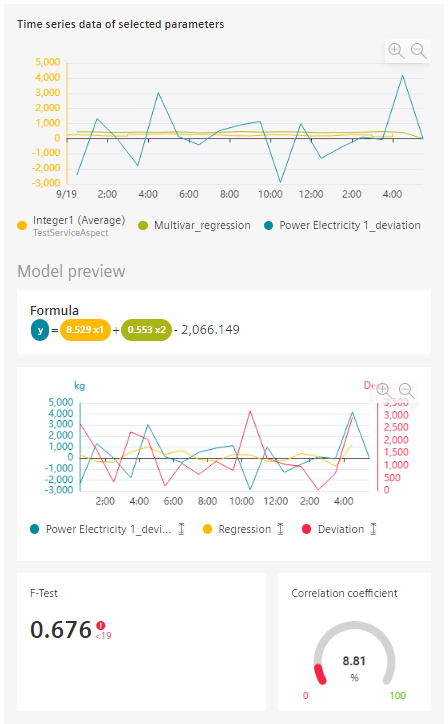
If necessary, you can optimize the model.
-
Confirm the creation of the two new KPI instances.
-
Save the model.
Result
You have created a model for the visualization of the multivariable regression.
After creating the first model for an asset, the MVR dashboard is created automatically.
A model can be used on the MVR dashboard for any other period to analyze the parameters.
Two new KPI instances are created.
NOTE
All variables in use must have synchronous time stamps for the values. The same type of aggregation must be selected for each variable to ensure synchronicity of the time stamps.