Results
Create a widget
Requirement
-
To visualize and calculate the data from the plant, such as production figures, machine operating times, or water consumption using KPIs, these figures must be transferred from the plant to the platform via the Asset Manager. The data structure of your plant is then automatically displayed in the app.
-
At least one dashboard is created on the desired asset.
Adding a widget
To add a widget to a user-defined dashboard, follow these steps:
-
Display the dashboard
-
If no widget has been created, select "Add first widget".
-
If widgets have already been created, click
 and select "Add widget".
The "Add widget" wizard is displayed.
Widget configuration
The creation of a widget takes place in 3 steps.
-
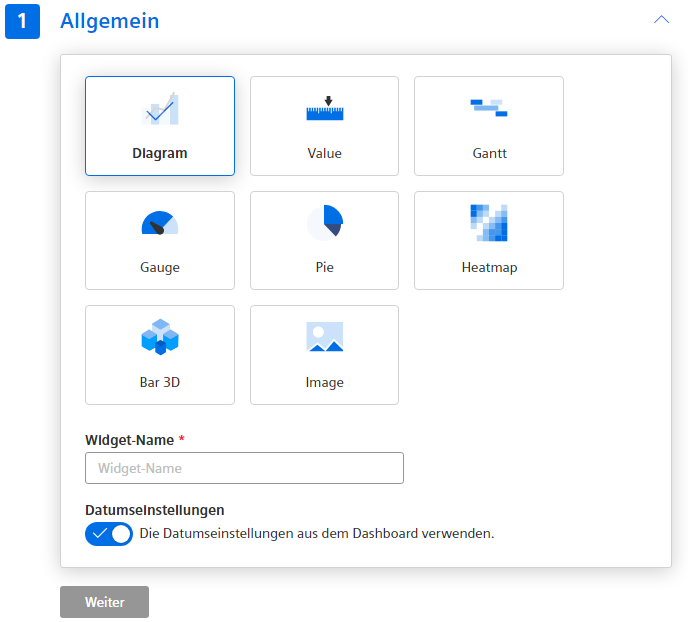
Step 1: General Select the widget type
-
Assign a name to the widget.
-
Select whether the date settings from the dashboard are to be applied.
If the widget uses date settings deviating from the dashboard, make the required specifications.
-
To apply the specifications, click "Next".
Step 2 is displayed.
-
-
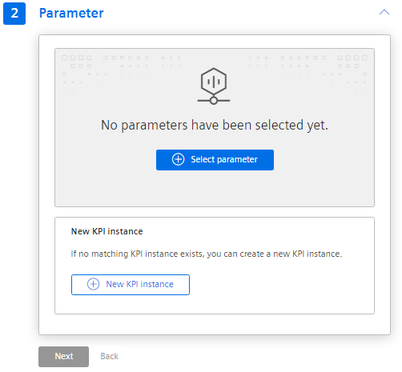
Step 2: Parameters
-
Select the parameters which are to be visualized in the widget.
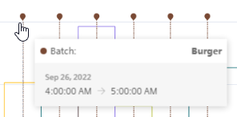
A parameter of the STRING type can be additionally selected, for example, to give production sections in the "Diagram" detail view a descriptive name.
Only the aggregation type "Last" is available for STRING type parameters.
Example representation:
-
If required, create a new KPI instance
Further information can be found in section "Editing settings for KPI instances".
-
-
Step 3: Details
These settings depend on the widget type, e.g. calculation period, y axis.
-
To create the widget, click "Create widget"
The widget is displayed at the dashboard.
To adjust the position and size of the widget, adjust the dashboard layout.
For more information, see the "Adapting a user-defined dashboard" section.
Defining date settings
With the date settings you define the time range from which the values are to be visualized. You can apply the dashboard date settings to a widget or define your own date settings for this widget.
The following variants are possible:
-
"Use the date settings from the dashboard" to use the time range that is defined in the dashboard.
Changes to the date settings of the dashboard are applied in all widgets of the dashboard.
-
To define a specific period, disable "Use the date settings from the dashboard".
-
Period
Define the duration (e.g. week). The start and end time are given by the predefined time ranges (day, week, month, year, etc.).
-
Use current date
To enter the date and time of the start time manually, deactivate this option.
The end time is determined through the "Period".
-
Offset
Indicate the number of days, weeks, months or years by which the start time should be offset.
The start time can be either in the future or in the past.
-
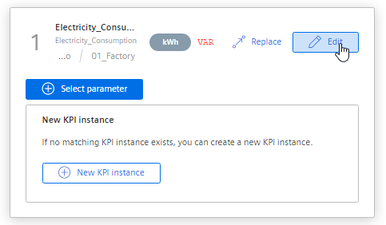
Procedure for selection of parameters
You can select either a variable or a KPI type as parameter. You can select up to 10 parameters.
-
To replace a selected parameter with another parameter, click "Replace".
-
To make further specifications for the selected parameter, click "Edit".
-
If required, enter an alternative label.
This label is displayed in the legend in the detail view instead of the asset and the aspect name of a parameter.
-
Select an aggregation for each variable.
You can find additional information on the aggregation functions here: AUTOHOTSPOT
The same parameter can be visualized in a widget with different aggregations.
-
Specify details for the visualization of the parameter:
Number of decimal places
Color
Type
-
Define limit values for warnings and alarms.
Limit values are displayed in the detail view as dashed lines.
If you have already defined limits for the parameter used, they are displayed preset in the widget. These limits can be overwritten.
-
-
In this step, you can create a new KPI instance and link the operands with the desired parameters.
You can find additional information on KPI instances here: Introduction to KPI calculations
Widget-specific details
You can find additional information on the details of the widgets here:
NOTE
When all required specifications are available for the first time, you can switch to a step independently of the sequence and make changes.
If you change the widget type, you have to make the specifications again.