Results
Creating an OEE dashboard
Description
You can create an OEE dashboard for each asset. The dashboard is created automatically on the basis of the settings made by you.
With the configuration, several OEE KPIs are generated and displayed in the OEE dashboard.
Procedure
To create an OEE dashboard, follow these steps:
-
Select an asset in My Plant.
-
Click "Add dashboard".
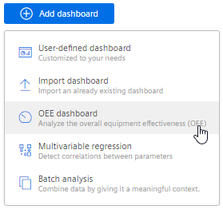
-
Select "OEE dashboard".
The "OEE settings" view is displayed.
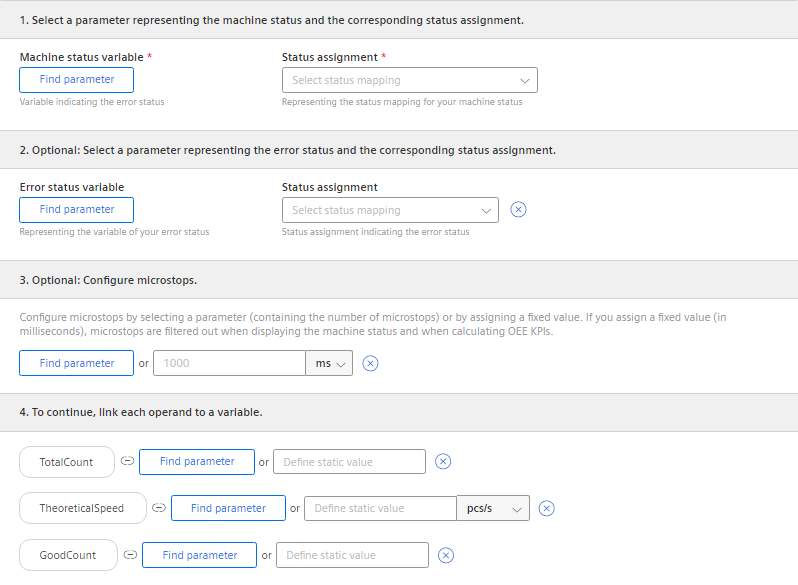
-
Select a variable representing the machine status and an associated status mapping.
-
Optional, if you want the dashboard to display the error analysis:
Select a variable that represents the error status and an associated status mapping.
You assign an understandable text to a numerical error code this way.
-
Optional:
Configure micro-stops.
-
Select a parameter and an aggregation function.
- or -
-
Enter a fixed value.
-
-
Link each operand to a variable.
-
Select the aggregation function for each variable.
-
Adapt the period that is displayed.
-
Click "Save".
Result
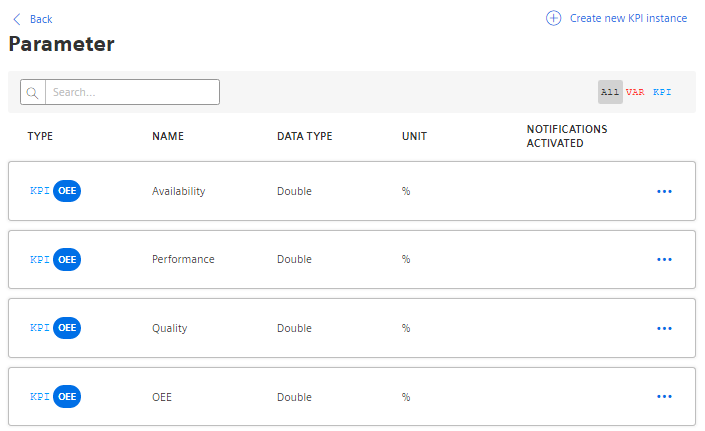
An OEE dashboard with the OEE analysis is automatically created.
In the parameter list, all KPI instances created automatically for the OEE analysis are displayed:
Editing OEE settings
If you have already created an OEE dashboard for an asset, you can edit the setting.
-
Select an asset in My Plant.
-
Select the OEE dashboard.
-
In the dashboard, click
 .
.
-
In the drop-down menu, select "Edit dashboard".
The dashboard editor is displayed.
-
Adjust the settings and click "Save".