Results
- SIMATIC Performance Insight V1.17
- Preface
- What's new?
- Get to know Performance Insight
- Configuring the Performance Insight
- Adapting the app
- Configuring types
- Setting parameters
- Parameters in Performance Insight
- Displaying a parameter list
- Displaying current values of a parameter
- Editing settings for variables
- Editing settings for KPI instances
- Saving the values of a KPI in a variable
- "Activate notifications" for variables with numerical data type and KPI instances
- "Activate notifications" for variables of the data type "Bool" and "String"
- "Counter" acquisition category
- Aggregation functions
- Operation
- Presenting the productivity of a plant transparently (OEE analysis)
- Configuring a step time analysis
- Configuring multivariable regression
- Evaluating the production of individual batches
- Creating user-defined dashboards
- Creating a dashboard
- Structure of the dashboards
- Creating widgets
- Introduction to widgets
- Create a widget
- Visualizing correlations (Diagram)
- Visualizing values (Value)
- Visualizing machine statuses (Gantt)
- Visualizing the violation of limit values (gauge)
- Visualizing the distribution of consumptions or quantities (Pie chart)
- Visualizing the intensity of data values (Heatmap)
- Visualizing relationships in 3D (3D bars)
- Linking an image for presentation
- Preview a widget
- Working with widgets
- Widget views
- Adapting a user-defined dashboard
- Exporting and importing dashboards
- Analyzing data
- Creating reports
- Quality codes
- Appendix
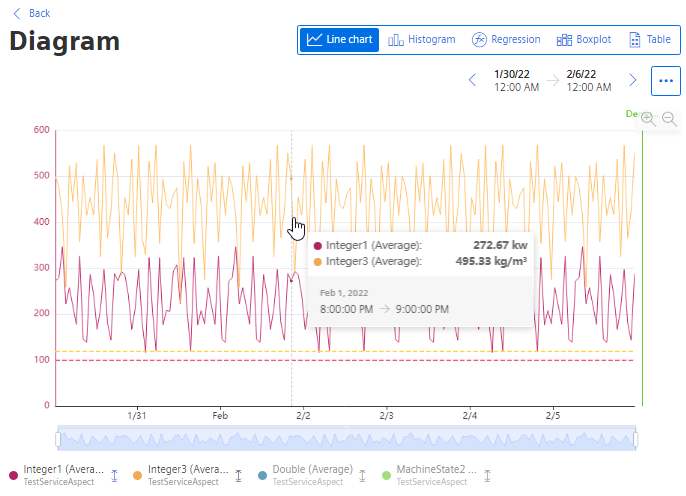
Line graph
The value gradient of the individual parameters is displayed as a line. The detail view shows the graphs of all parameters in the colors that you have defined in the display options.
-
Show/hide parameter: Click the parameter name below the display. The y-axis is automatically adjusted.
-
Show/hide limit: Click
 next to the parameter name
-
Display details about a data point: Hover with the cursor over a data point.
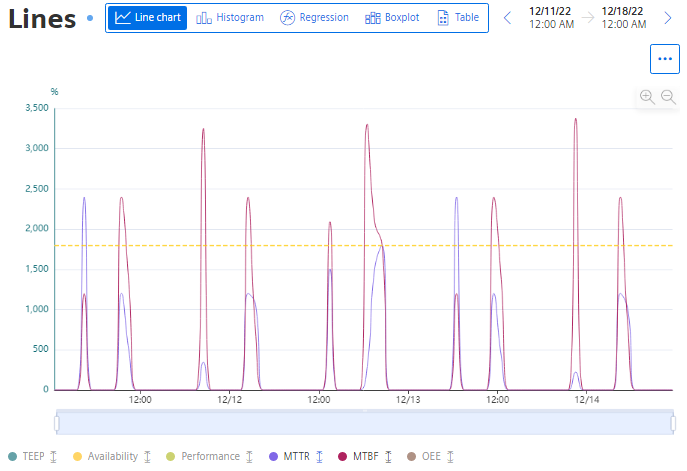
Visualization as spline curve
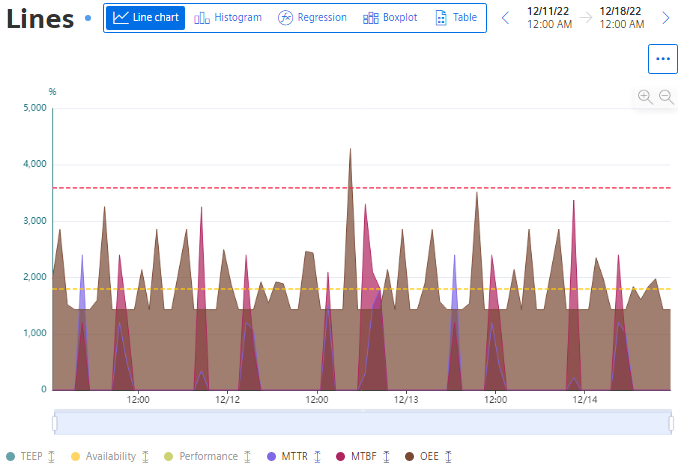
Visualization as area graph
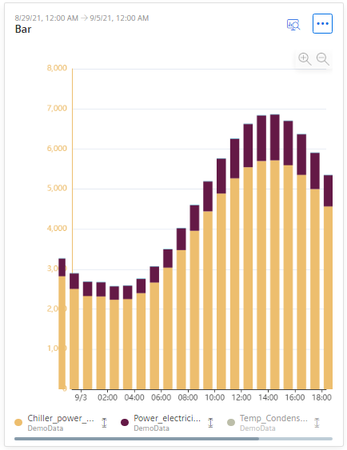
Visualization as a stacked bar graph
Chap. 5.5.5.1