Results
- SIMATIC Performance Insight V1.17
- Preface
- What's new?
- Get to know Performance Insight
- Configuring the Performance Insight
- Adapting the app
- Configuring types
- Setting parameters
- Parameters in Performance Insight
- Displaying a parameter list
- Displaying current values of a parameter
- Editing settings for variables
- Editing settings for KPI instances
- Saving the values of a KPI in a variable
- "Activate notifications" for variables with numerical data type and KPI instances
- "Activate notifications" for variables of the data type "Bool" and "String"
- "Counter" acquisition category
- Aggregation functions
- Operation
- Presenting the productivity of a plant transparently (OEE analysis)
- Configuring a step time analysis
- Configuring multivariable regression
- Evaluating the production of individual batches
- Creating user-defined dashboards
- Creating a dashboard
- Structure of the dashboards
- Creating widgets
- Introduction to widgets
- Create a widget
- Visualizing correlations (Diagram)
- Visualizing values (Value)
- Visualizing machine statuses (Gantt)
- Visualizing the violation of limit values (gauge)
- Visualizing the distribution of consumptions or quantities (Pie chart)
- Visualizing the intensity of data values (Heatmap)
- Visualizing relationships in 3D (3D bars)
- Linking an image for presentation
- Preview a widget
- Working with widgets
- Widget views
- Adapting a user-defined dashboard
- Exporting and importing dashboards
- Analyzing data
- Creating reports
- Quality codes
- Appendix
Adapting a user-defined dashboard
Description
You can adjust the layout of a user-defined dashboard.
Procedure
To change the layout of a dashboard, follow these steps:
-
Click
 in the dashboard.
-
Select
 "Adjust dashboard layout".
The dashboard is in edit mode. Grid lines are displayed in the background of the dashboard.
-
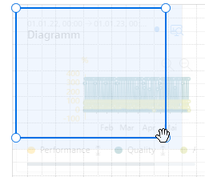
To move a value, select the widget and drag it with the mouse to a different spot.
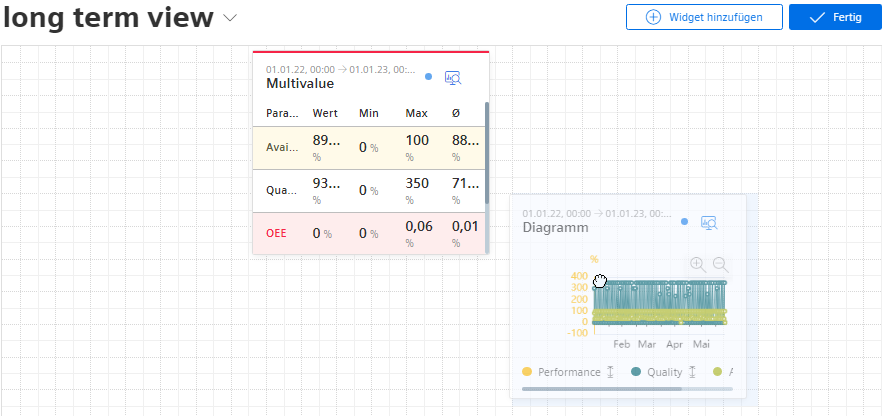
Permitted new positions for the widget are indicated through a blue shadow.
-
To select the size of a widget, select the widget and drag the corner point of the marking to a new position.
-
To add another widget to the dashboard, click "Add widget".
-
To finish editing, click "Finish".
Chap. 5.5.6