Results
- SIMATIC Performance Insight V1.17
- Preface
- What's new?
- Get to know Performance Insight
- Configuring the Performance Insight
- Adapting the app
- Configuring types
- Setting parameters
- Parameters in Performance Insight
- Displaying a parameter list
- Displaying current values of a parameter
- Editing settings for variables
- Editing settings for KPI instances
- Saving the values of a KPI in a variable
- "Activate notifications" for variables with numerical data type and KPI instances
- "Activate notifications" for variables of the data type "Bool" and "String"
- "Counter" acquisition category
- Aggregation functions
- Operation
- Presenting the productivity of a plant transparently (OEE analysis)
- Configuring a step time analysis
- Configuring multivariable regression
- Evaluating the production of individual batches
- Creating user-defined dashboards
- Creating a dashboard
- Structure of the dashboards
- Creating widgets
- Introduction to widgets
- Create a widget
- Visualizing correlations (Diagram)
- Visualizing values (Value)
- Visualizing machine statuses (Gantt)
- Visualizing the violation of limit values (gauge)
- Visualizing the distribution of consumptions or quantities (Pie chart)
- Visualizing the intensity of data values (Heatmap)
- Visualizing relationships in 3D (3D bars)
- Linking an image for presentation
- Preview a widget
- Working with widgets
- Widget views
- Adapting a user-defined dashboard
- Exporting and importing dashboards
- Analyzing data
- Creating reports
- Quality codes
- Appendix
Reason tree
The reason tree is a structured representation of the different states in which a machine or plant can be. OEE is a tool for continuous improvement, and a crucial step towards improvement is the analysis of the reasons for downtimes of machines and plants. You can improve the performance of a plant by identifying the root causes of downtimes, such as late delivery to stations. To enable this analysis, you need a detailed catalog of fault reasons, the reason tree.
The reason tree is based on the specified time categories:
-
Production time (Net Production Time)
-
Planned downtime (Planned Downtime)
e.g. maintenance
-
Unplanned downtime (Unplanned Downtime)
e.g. machine fault, material shortage
A fault reason (reason) corresponds to a time category.
In the reason tree you define detailed fault reasons according to your requirements and experience. Five levels of detail are available.
The reasons you have created are available when creating an OEE dashboard, when editing a status assignment, and for the formula for calculating a KPI type.
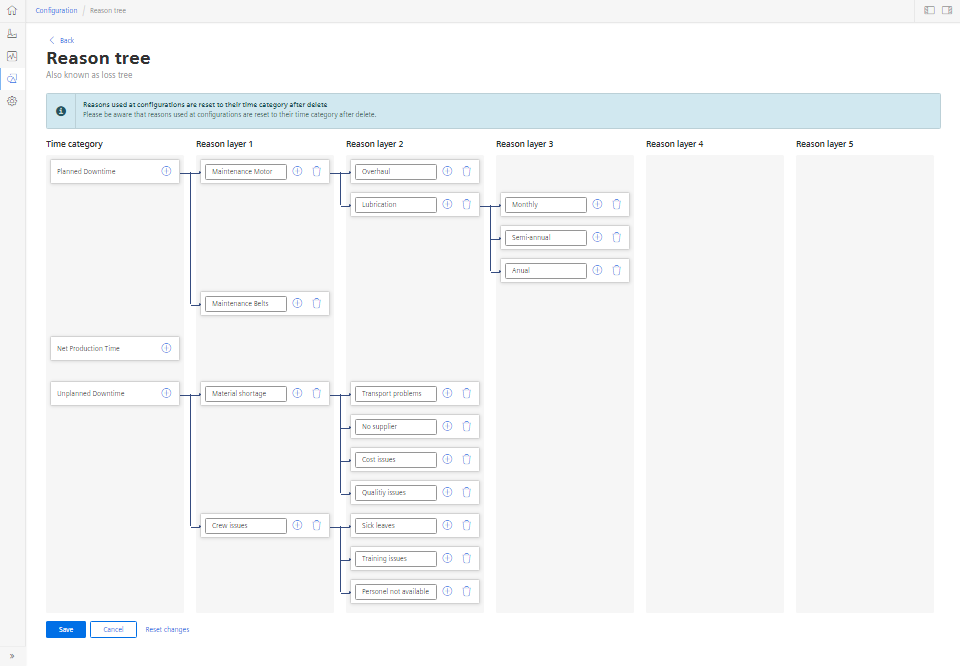
The reason tree and the created fault reasons (Reasons) apply to the entire tenant.
Chap. 4.2.4