Results
Structure of the dashboards
Overview
The dashboards contain a graphical representation of variables or KPI types. Widgets are used for the graphical representation. A maximum of 5 dashboards can be created per asset object within My Plant.
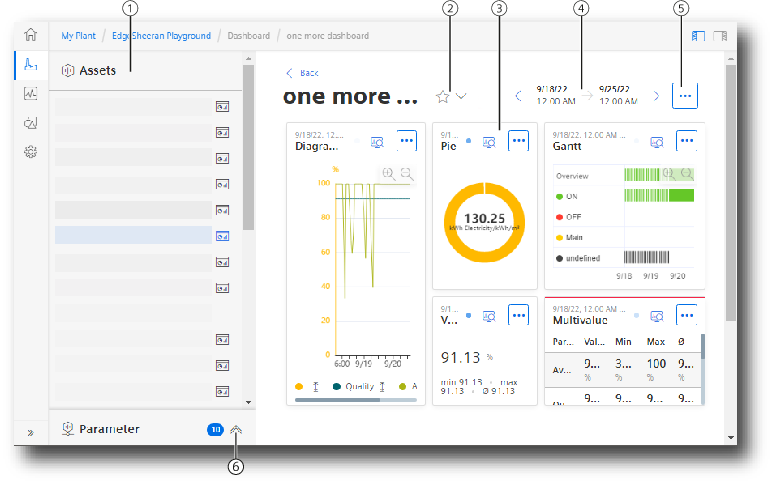
The figure below shows the layout of a dashboard:
|
① |
My Plant |
|
② |
Marking the menu with all dashboards of the asset / dashboard as Favorite |
|
③ |
Widgets Visualization of KPIs or variables |
|
④ |
Period |
|
⑤ |
Menu: "Add widget", "Adjust dashboard layout", "Export dashboard", "Edit dashboard", "Delete dashboard" |
|
⑥ |
Parameter list |
NOTE
If the selected period for the dashboard or one of the widgets is in the future, the dashboard automatically updates every 30 seconds.