Results
My Plant
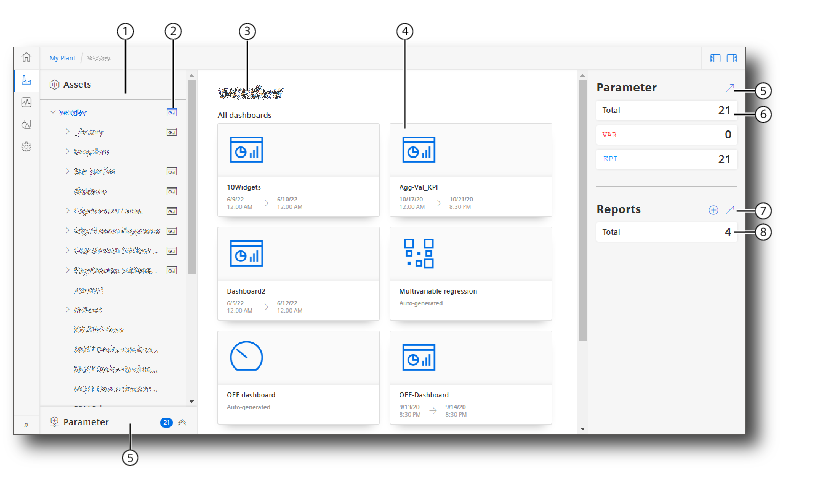
"My Plant" view
The "My Plant" view ("My Plant") displays the available assets.
|
① |
Assets in the "My Plant" view ("My Plant") |
|
② |
Number of dashboards created on the asset |
|
③ |
Selected asset |
|
④ |
Dashboards available at the asset |
|
⑤ |
Open parameter list |
|
⑥ |
Overview of the variables and KPIs available at the asset |
|
⑦ |
Open list of report configurations Configuring a new report |
|
⑧ |
Number of reports configured for the asset |
 |
Refreshes the assets display |
Dashboard
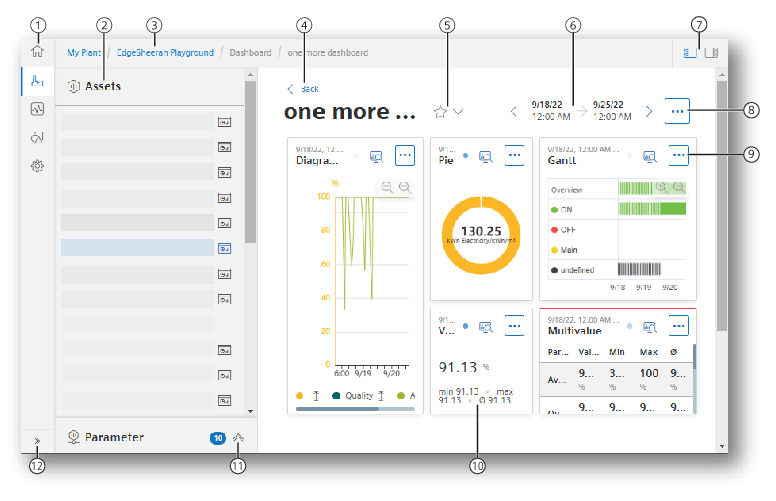
The figure below shows a user-defined dashboard.
|
① |
Navigation bar - selection of a view |
|
② |
Assets in the "My Plant" view ("My Plant") |
|
③ |
Breadcrumb navigation |
|
④ |
Navigation back |
|
⑤ |
Marking an overview of the dashboards at the asset / dashboard as favorite |
|
⑥ |
Displayed period, time navigation |
|
⑦ |
Show/hide the navigation area left / right of the info panel |
|
⑧ |
Menu button with options on the dashboard |
|
⑨ |
Menu button with options on a widget |
|
⑩ |
Widget |
|
⑪ |
Show/hide parameter list |
|
⑫ |
Show/hide texts of the navigation bar |
The icon  next to an asset indicates that at least one dashboard is available at the asset.