Results
"Overview" view
Description
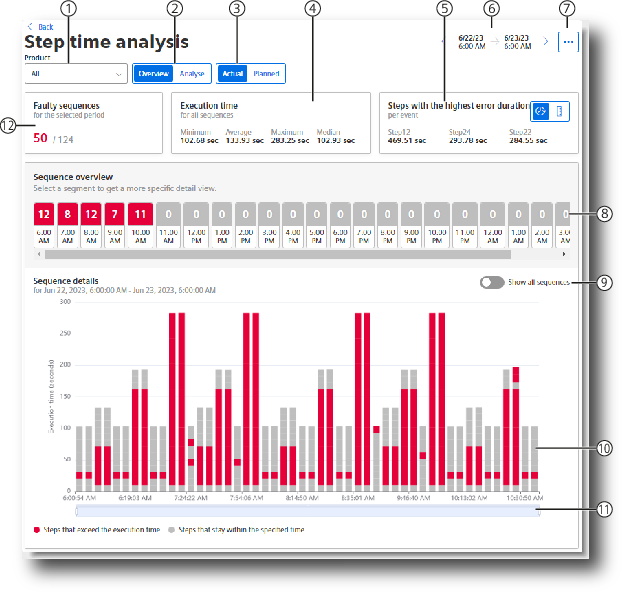
The overview is displayed in the "Step time analysis" dashboard.
|
① |
Selecting a product for which the step time analysis is to be displayed |
|
② |
Switch between the "Overview" and "Analysis" views. |
|
③ |
Switch between the views with actual or planned limit values. |
|
④ |
Execution time for all sequences |
|
⑤ |
Displaying the steps with the highest error rate or error duration |
|
⑥ |
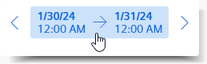
Selection of the period for which the step time analysis is displayed |
|
⑦ |
Menu: Settings, exporting data, more analyses |
|
⑧ |
Sequence overview: Display and selection of a specific sequence for detailed display |
|
⑨ |
Show all sequences |
|
⑩ |
Sequence details: Displaying all sequences and defined steps in the selected period. When selecting a single step, the Trend view of the step opens. |
|
⑪ |
Restricting and shifting the displayed time period |
|
⑫ |
Displaying the number of faulty sequences |
The following options are available in this dashboard view:
Product selection
You decide whether to display the step time analysis for all products or a specific product. Product-independent limit definitions are also displayed and listed as "Unassigned".
Displaying the number of faulty sequences
The area ⑫ "Faulty sequences " shows the proportion of faulty sequences of the total number of sequences within the period selected under ⑥ . The faulty steps are displayed in red.
Execution time for all sequences
In the area ④ "Execution time", you can get information on the execution time of all sequences. It displays the minimum, maximum and average values in seconds, as well as the median execution time.
Selecting the analysis period
The area ⑥ facilitates specifying a display period. You can change the display period by switching to the previous or next period using the arrows.
More information is available in section Navigation in the app.
Displaying steps with the highest error rate or error duration
In the area ⑤, you can display steps with either the highest error rate or error duration.
-
 Error duration view
-
 Error rate view
Sequence overview
The area ⑨ "Sequence overview" provides an overview of the sequences of the selected period. The representation varies depending on the length of the selected period. If you have selected a week as the display period, for example, 7 day segments are displayed in this area. Each segment contains the number of faulty steps and the period.
By clicking on a segment, you can see the data of the segment in the detailed view ⑩ and the display period changes to the
hour display. By clicking on  , you return to the view of the selected period.
When you hover with the mouse pointer over a segment, you see the detailed information of the respective step as a tooltip.
Detail view
The area ⑩ is the detail view. Here, you can see a graphical representation of the data of the sequences and their steps over the selected period. Faulty steps which exceed the time limit are shown in red. Steps marked in gray are within the limits. By moving the mouse pointer over the individual steps, you can see the details for the individual sequences.
By clicking on a single step, you open the analysis view of the specific step. From there, you can click ② to return to the Overview view.
NOTE
If the selected period for the dashboard is in the future, the dashboard automatically updates every 60 seconds.