Results
Navigation in the app
In the views of the app, there are navigation elements which lead you quickly to the visualizations, information and configurations.
Overviews
The navigation bar leads to the overview views:
 |
My Plant (My Plant) |
 |
Analysis |
 |
Configuration |
 |
Settings |
The overview views at the assets of My Plant allow quick display of the existing dashboards. Here you can create automatically generated dashboards and user-defined dashboards.
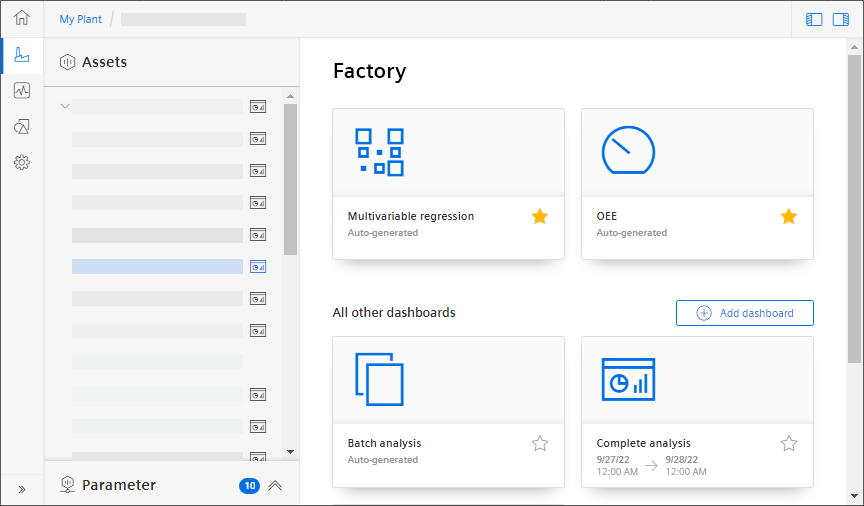
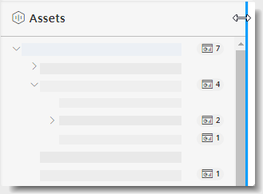
You can adapt the width of My Plant.
Breadcrumb navigation
The path that leads to the current view is displayed at the upper edge.
To access a previous view, click an individual entry.
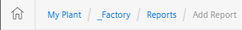
In addition, a link is displayed which returns you to the superordinate overview.

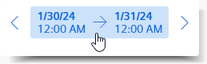
Displayed period, navigation in the time
Buttons to adjust the displayed period are available in dashboards and in the detail view of a widget.
-
To move the displayed period, click
 or
or  .
.
The displayed period is moved by one offset which corresponds to the duration of the period.
-
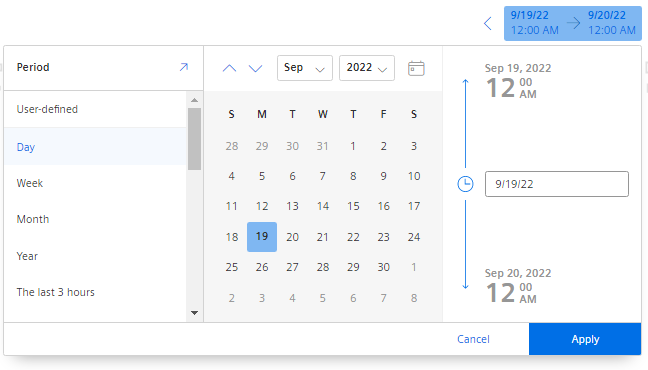
To specify a period, click the displayed period.
The choice for the period and a calendar are displayed.
-
To determine the duration of the displayed period, select a period from the drop-down list.
-
To use a user-defined period for the display, click "User-defined".
Input fields for specifying the period are displayed.
-
Click
 to define a new user-defined period in general.
-
In the calendar, select the start date and if applicable, the end date and the time.
-
Select another month or another year from the drop-down lists.
-
To display the period that includes today’s date "Today" once again, click
 .
.
-
Click "Apply".
-
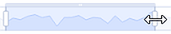
The displayed period for the diagram display can be limited and moved below the display.
Showing / hiding a display area
Information areas and navigation elements can be shown and hidden, as required.
 |
Shows the texts for the navigation bar. |
 |
Shows the list of available parameters at the selected asset. |
 |
Shows or hides the list of assets on the left-hand side. |
 |
Shows or hides the information panel on the right-hand side. For example. the overview of parameters, reports, KPI types. |
Direct call of a dashboard via URL
-
If you view a dashboard by directly calling a URL, you can hide My Plant retentively.
Add the query parameter "
?leadingRegionCollapsed=true" to the URL of the dashboard.
Menu button
On widgets and dashboards, the relevant commands are contained in the menu of the button with 3 dots:

On automatically generated dashboards, for example:
-
Editing settings
-
Exporting data
At user-defined dashboards e.g.:
-
Adding a widget
-
Editing the layout of the dashboard
-
Exporting a dashboard
-
Editing a dashboard
-
Deleting a dashboard
At widgets e.g.:
-
Editing
-
Deleting
-
Copying
-
Exporting data
Views
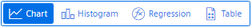
Dashboards offer different views.
You open the detail views of a widget by clicking  .
.
Widgets offer different detail views.
Adapting views
Parameters in visualizations can be shown or hidden.
If required, show the configured limit values.
NOTE
"Week" corresponds to a calendar week, beginning with the last Sunday.
"Last 7 days" corresponds to the last 7 days, irrespective of the week day.
This also applies for "Month" and "Year".
"Today" corresponds to the period which includes the current date.