Results
Machine status
Detail view
Description
-
Click
 "Details" in the OEE analysis at the widget "Machine status".
The "Gantt" view is displayed.
The widget shows the status of several parameters at a glance using different color codes. For example, the status can represent the current state or the state within a specific time range.
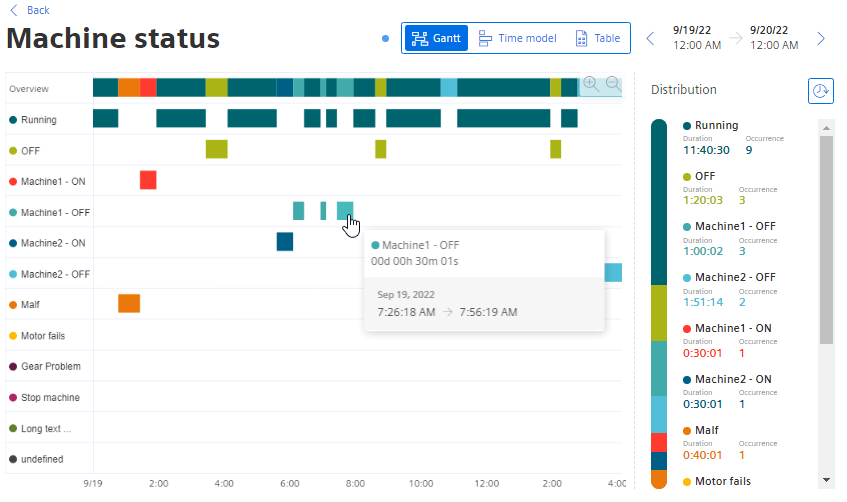
To see the exact value of a KPI, move the cursor over one of the bars.
Only the parameters that have a value are displayed.
Distribution
 shows the distribution by number of the respective machine state.
 shows the distribution by duration.
Time model
Description
-
Click
"Details" in the OEE analysis at the widget "Machine status".
The "Gantt" view is displayed.
-
Select the "Time model" view.
The view shows an overview of the time categories used, such as the total calendar time, the shares of planned and unplanned downtime, etc.
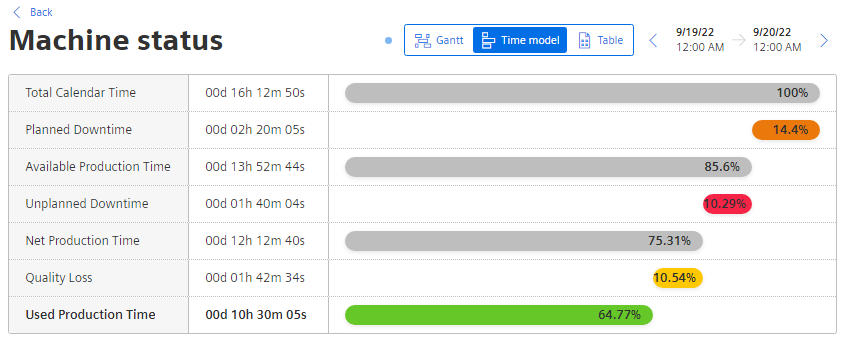
The quality loss is calculated based on the quality rate.
Example: If the net production time is 60% and the quality rate is 90%, then the quality loss is 60*(1-0.9) = 5.4%).
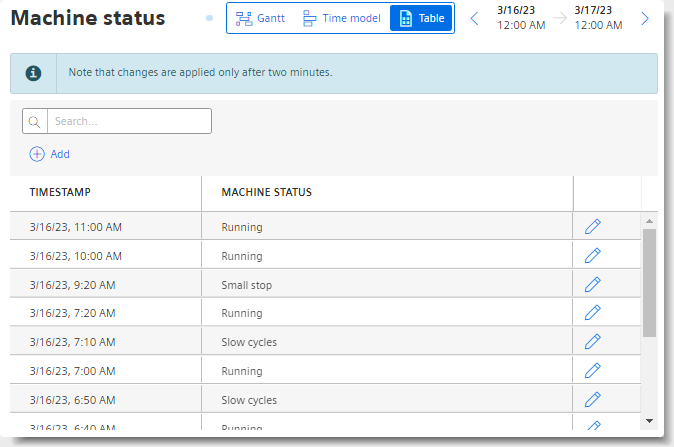
Table
Description
-
Click
"Details" in the OEE analysis at the widget "Machine status".
The "Gantt" view is displayed.
-
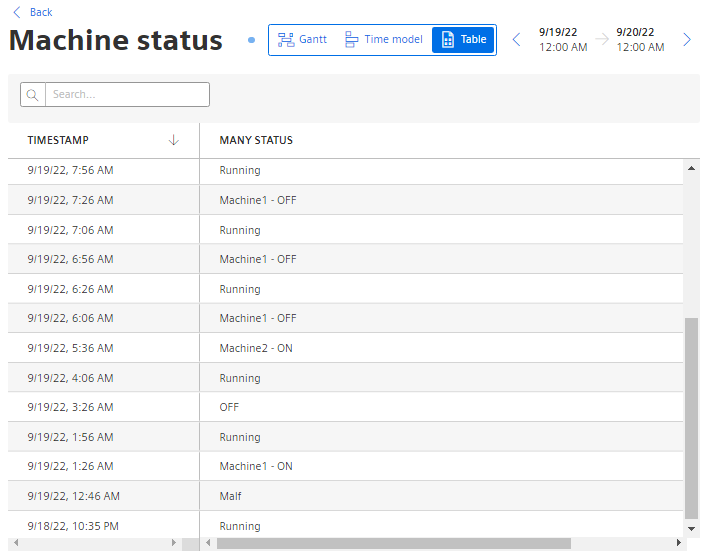
Select the "Table" view.
The view shows a tabular overview of the machine states in the displayed period.
-
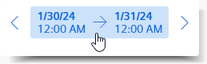
To display the analysis for a different time period, use the operator controls to navigate in time.
-
To filter the display, enter a string in the search field.
All machine states for which a cell contains the character string are displayed.
Example: They only show the machine state "Stopped".
-
To sort the table, click in a column header.
You can change a specification of the machine state by clicking on the entry.
Change machine status
The displayed machine status can be changed. This is useful or necessary if the machine status has not been recognized correctly. This can be caused by an incorrect transfer of parameter values or a configuration that needs to be adapted.
A changed machine status is used for the correct OEE analysis.
Procedure
To change the displayed machine status, follow these steps:
-
Display an automatically generated OEE dashboard.
-
Click "Change machine status" above the Gantt chart for the machine status.
The "Table" view of the machine status is displayed.
-
In the line of a machine status, click
 .
.
-
Select a machine status in the drop-down menu of the line.
-
To save the change, click on the three dots (
 ).
).
Insert machine status
-
To insert a period in the history, click
 "Add".
The "Insert entry" dialog is displayed.
-
Select the time stamp and the machine status.
-
Click "Save".
A new time stamp with the selected machine status is inserted.