Results
Displaying the OEE dashboard
Description
The OEE dashboard is created automatically. An analysis is also automatically created for available sub-assets.
The OEE dashboard offers the following possibilities:
-
Quick overview of KPIs and machine status
-
Detail view for KPIs and machine status
-
Error analysis: Overview of the most common causes of production interruptions
-
Adjustable displayed period
-
Exporting data
-
Access to the OEE settings
-
Display errors that occurred during analysis.
You cannot change the layout of the dashboard.
Procedure
To display the OEE analysis, proceed as follows:
-
Select "Analysis > OEE" in the navigation bar.
The preview of the available OEE dashboards is displayed.
-
To find a dashboard quickly, use the search function.
-
To see the best values of a KPI quickly, use the sort function.
-
-
To display a dashboard, click
 .
.
- or -
-
Select an asset in My Plant.
An overview of the dashboards available on the asset is displayed.
-
Click "OEE dashboard".
The dashboard shows the KPIs of the asset.
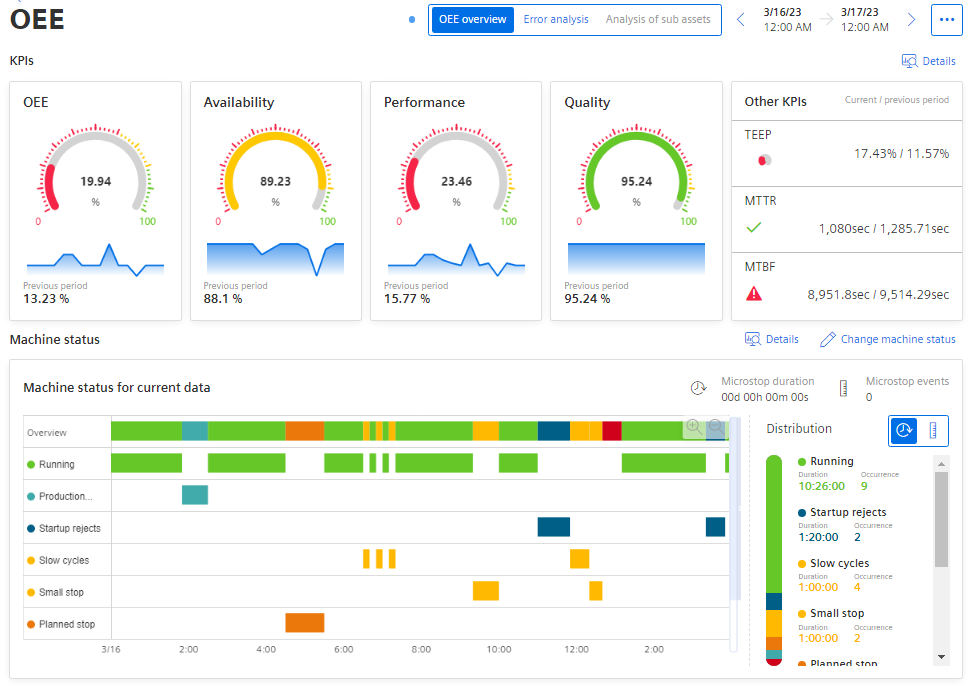
The colors of the pie charts indicate whether limits have been exceeded:
-
Green: Value within limits
-
Yellow: Value within the warning limits
-
Red: Value within the alarm limits
-
Blue: No limits have been specified.
The limits are pre-defined but can be adjusted for each KPI. You can find information on limits here: "Activate notifications" for variables with numerical data type and KPI instances
In the "Other KPIs" area, you can see the values of the TEEP, MTTR, and MTBF KPIs. As soon as limit values have been defined for the KPIs MTTR and MTBF, the symbols for warning or alarm are displayed accordingly when they are violated.
In the "Machine status for current data" view, the Gantt widget displays an overview of each machine status and a summary. Only the variables that have a value are displayed.
You can find more information on the OEE KPIs here: Overview of the overall equipment effectiveness (OEE).
You can find more information on the detailed views of the KPIs here: KPIs.
For more information about the detail views of the Gantt widget, see: Machine status.
-
To visualize the interaction of the KPIs in a diagram, click "Details".
-
To change the machine status for a timestamp, click "Change machine status".
The table view of the machine status is displayed. Here, you have the option to change an individual status.
-
To display the settings for the OEE analysis and edit them, click
 .
.
Finding errors of the analysis
If the analysis cannot be executed fully because the configuration is faulty or no data values are available, a button is displayed indicating this.

-
To view details on the errors, click the button.
The information panel on the right side lists details about the errors found.
-
To hide the display of an error, mark it as "Read".
NOTE
If the selected period for the dashboard or one of the widgets is in the future, the dashboard automatically updates every 30 seconds.