Results
Performance monitoring
OEE/KPI development
The "Key Performance Indicator (KPI)" and the "Overall Equipment Efficiency (OEE)" are refreshed in the following time intervals:
-
If predefined time intervals (e.g. "Today" or "Current Month") are selected, then the KPI/OEE results are always refreshed 10' and 40' after the full hour.
Predefined time intervals also include the data of the current workday.
-
If a user-defined time interval is selected, then the requested data is immediately calculated.
If the user-defined time interval includes the current workday, then data is refreshed 10' and 40' after the full hour.
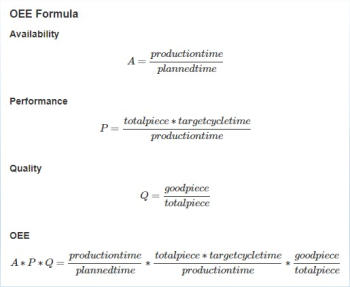
The OEE formula for "Analyze MyPerformance /OEE" has the following composition:
If you have activated "Analyze MyPerformance /OEE Pro", the formula that you set under "Configuration" for the Analyze MyPerformance /OEE Pro assets is used.
You will find further information on processing the KPI calculation under: Editing the KPI calculation.
Selecting an asset
-
Select the required asset from the overview of the "Performance Monitoring" window.
-
Click on the following icon for "Analyze MyPerformance /OEE":
Click on the following icon for "Analyze MyPerformance /OEE Pro":
- OR -
Open the drop-down list in the upper left window area and select the required asset.
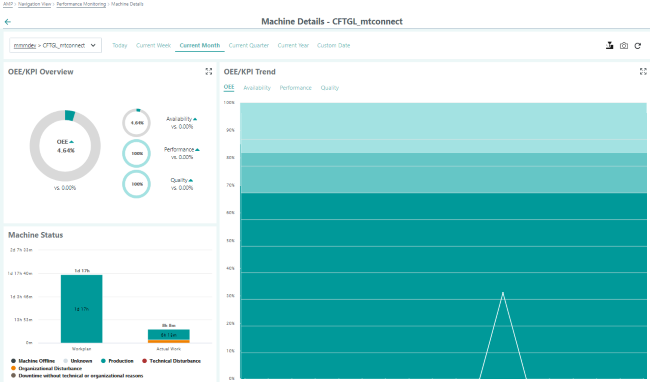
The window with the machine details opens. -
Click on the required time period.
The following window opens for "Analyze MyPerformance /OEE":
The following window opens for "Analyze MyPerformance /OEE Pro":
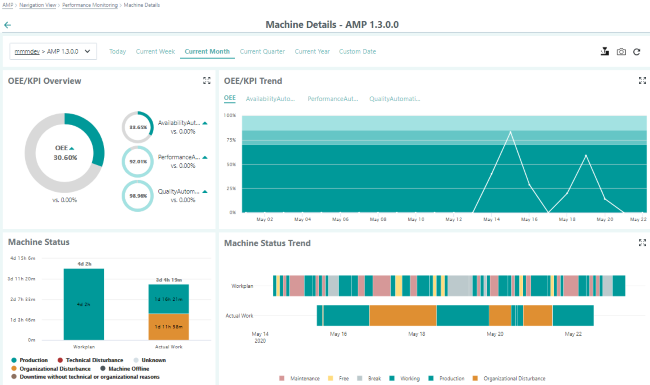
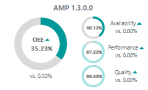
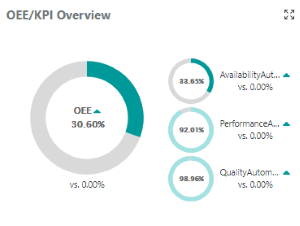
OEE/KPI overview
In the "OEE/KPI Overview" window area, the OEE/KPI values for the selected time interval are displayed:
-
Availability
-
Performance
-
Quality
You can see the OEE value in percent in the circles.
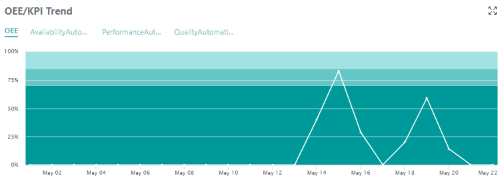
The values are graphically presented in the "OEE/KPI Trend" window area.
Click on the required monitoring parameter in order to display the OEE/KPI trend:
-
OEE
-
Availability
-
Performance
-
Quality
You can edit the designations of the KPI labels "Availability", "Performance" and "Quality" with Analyze MyPerformance /OEE
Pro.
Further information on this can be found under: Editing the display.
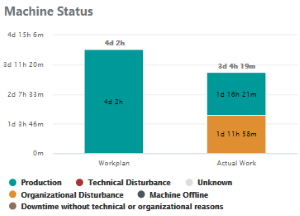
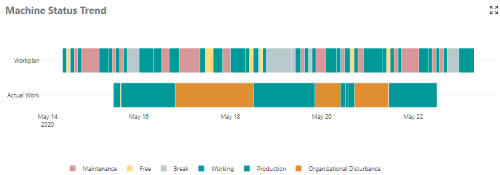
Machine status
The duration of the planned machine status (work plan) and the duration of the actual machine states (actual work) are shown juxtaposed in the machine status. You have the option of displaying and hiding individual states.
-
Production
-
Technical Disturbance
-
Unknown
-
Organizational Disturbance
-
Machine Offline
-
Downtime without technical or organizational reasons
You see a comparison of the workplan and the actual work in the "Machine Status" window area. Click on the machine status
below the bar diagram.
The selected machine status is displayed or hidden in the overview.
In the "Machine Status Trend" window area, "Work Plan" and "Actual Work" are graphically displayed.
The following states are displayed:
-
Maintenance
-
Free
-
Break
-
Working
-
Production
-
Organizational Disturbance
You can configure the "Actual Work" area via three levels.
You can find additional information in Chapter: Editing the production level.
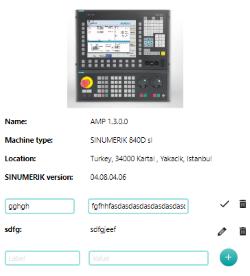
Machine information
If you click on the "Machine information" icon, you will receive the following information about the machine:
-
Name
-
Machine type
-
SINUMERIK version
-
Individual values
NOTE
To ensure that machine details are not saved by cookies, regularly empty the cache and delete the machine information in the machine history.