Results
Overview
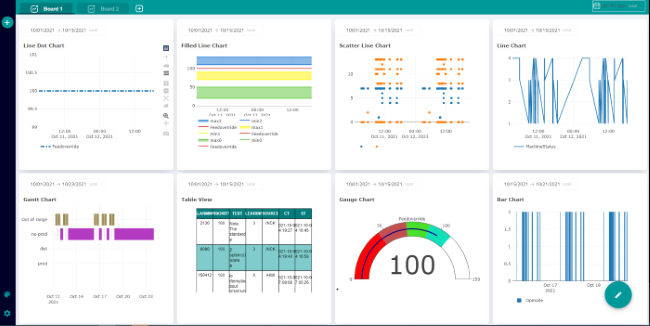
"My Dashboards" provides you with the opportunity of configuring new charts and using them for other assets in your tenant.
Parameters and icons
|
Parameter |
Description |
|
|---|---|---|
 |
Opens the tab with your configured dashboard. More information is provided in Chapter: Editing tabs |
|
 |
Generates an additional tab. More information is provided in Chapters: |
|
 |
Is displayed when opening and updating a window. |
|
 |
Opens the "Dashboard Settings" template menu. This icon only appears in menu "My Dashboards". More information is provided in Chapter: |
|
 |
The "Pen" icon activates the edit menu: |
|
 |
The "Floppy disk" icon opens the dialog box to save as template. |
|
 |
Opens the color menu with the following options:
|
|
 |
Opens the menu for graphical diagram design and tab editing:
|
|
 |
The "+" icon opens the menu to create a chart. |
|
 |
The "Line Charts" icon opens all available line charts. |
|
 |
Opens the menu for creating a line chart. |
|
 |
Opens the menu for creating a line dot chart. |
|
 |
Opens the menu for creating a scatter line chart. |
|
 |
Opens the menu for creating a filled line chart. |
|
 |
Opens the menu for creating a bar chart. |
|
 |
The "Indicator Charts" icon opens all available indicator charts. |
|
|
|
Opens the menu for creating an indicator chart. |
|
 |
Opens the menu for creating a gauge chart. |
|
 |
Opens the menu for creating a table overview. |
|
 |
Opens the menu for creating a Gantt chart. |
|
Procedure
-
In the machine overview, select an asset and click on the button with dots at the lower right on the asset. The drop-down list with the menu selection opens.
-
To open the "My Dashboards" window, select the "My Dashboards" entry.
You have the following options to continue editing: