Results
Generating charts
Using the "My Dashboards" function, you can create and edit line, bar, indicator and Gantt charts as well as table overviews.
Icons and buttons
|
Parameter |
Description |
||
|---|---|---|---|
 |
The "+" icon opens the menu to create a chart. |
||
 |
The "Gear wheel" icon opens the menu for graphic chart layout and tab editing:
|
||
|
Chart type |
|||
 |
Line charts |
The "Line Charts" icon opens all available line charts. |
|
 |
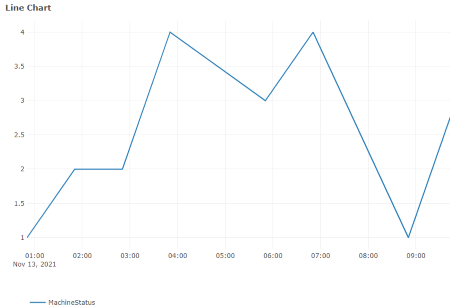
Line chart |
Opens the menu for creating a line chart. |
|
 |
|||
 |
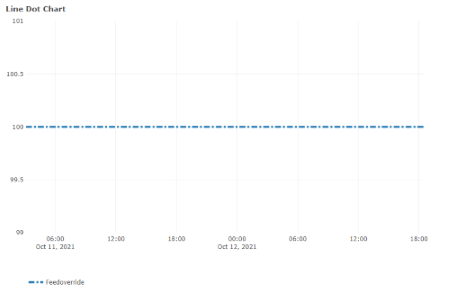
Line dot chart |
Opens the menu for creating a line dot chart. |
|
 |
|||
 |
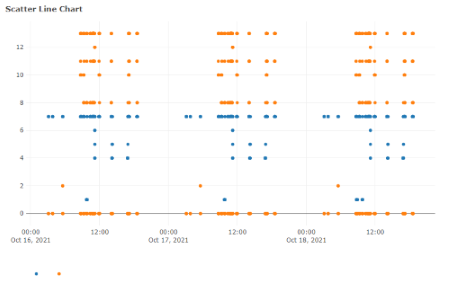
Scatter line chart |
Opens the menu for creating a scatter line chart. |
|
 |
|||
 |
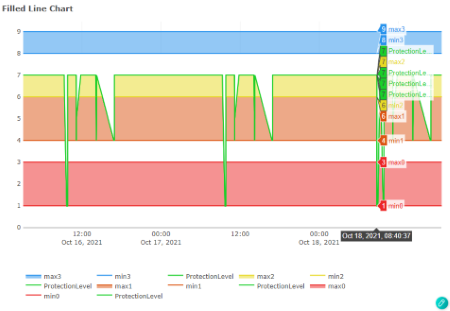
Filled line chart |
Opens the menu for creating a filled line chart. |
|
 |
|||
 |
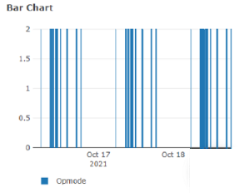
Bar chart |
Opens the menu for creating a bar chart. |
|
 |
|||
 |
Indicator Charts |
The "Indicator Charts" icon opens all available indicator charts. |
|
|
|
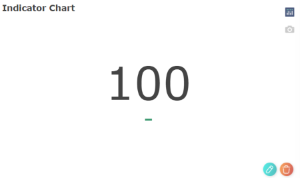
Indicator chart |
Opens the menu for creating an indicator chart. |
|
 |
|||
 |
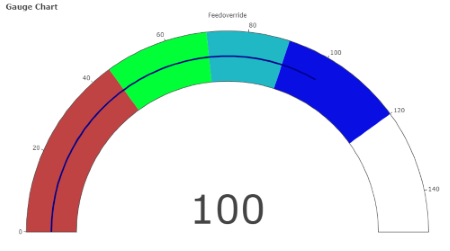
Gauge chart |
Opens the menu for creating a gauge chart. |
|
 |
|||
 |
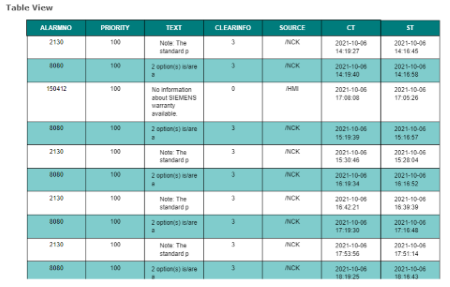
Table view |
Opens the menu for creating a table overview. |
|
 |
|||
 |
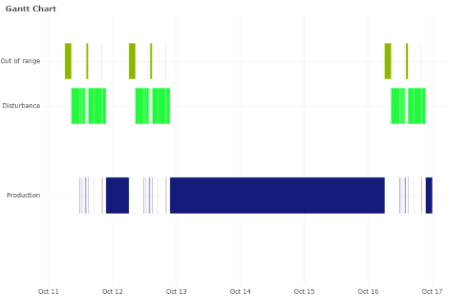
Gantt chart |
Opens the menu for creating a Gantt chart. |
|
 |
|||
|
Parameters and functions |
|||
|
New Chart |
|||
|
Asset |
Displays the asset selected in the machine overview. More information is provided in Chapters: |
||
|
Aspect |
Opens the drop-down list with the predefined aspects. More information is provided in Chapter:Aspects |
||
|
Variables |
Opens the drop-down list with the predefined variables. More information is provided in Chapter: Configuring variables |
||
|
Add ... |
Confirms and supplements the selected aspects and variables. |
||
|
Create a New KPI |
Opens the menu for creating a new KPI:
Number of variables per KPI: |
||
 |
Deletes the selected parameter. The respective check box must be deactivated. |
||
 |
Adds a new value range or task to filled line charts, gauge charts and Gantt charts. |
||
 |
Deletes the value ranges or tasks in filled line charts, gauge charts and Gantt charts. |
||
|
Date Time Range |
|||
 |
Opens the calendar function to define a time period. More information on the calendar is provided in Chapter: |
||
|
Chart name (optional) |
Provides the option of entering a chart name. |
||
Procedure
-
In the "My Dashboards" window, click on the "+" icon in the upper left-hand part of the window.
-
Additional editing icons are displayed.
Click the desired chart type to create a new chart. -
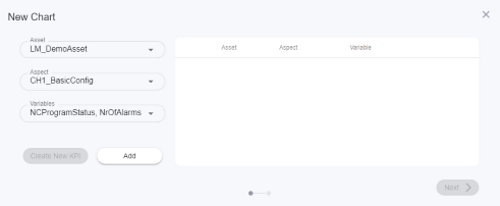
The window to select aspects and variables opens.
The name of the asset that you selected is automatically displayed in the "Asset" field.-
Select the required entry from the "Aspect" drop-down list.
-
Select the required options from the "Variables" drop-down list.
-
Click on "Add".
-
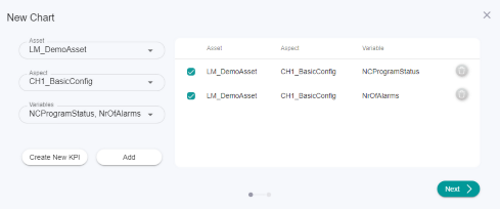
-
The selection is displayed.
Activate the required check box and click the "Next" button.
-
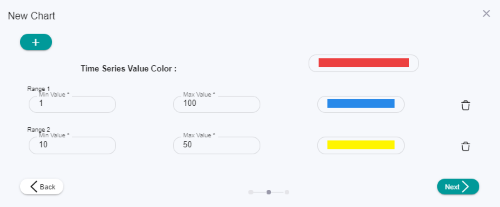
The following window opens for the "Filled Line Chart":
-
Click the "+" icon to create a new value range.
-
Click in the Color input field to select a color.
-
Click on "Next".
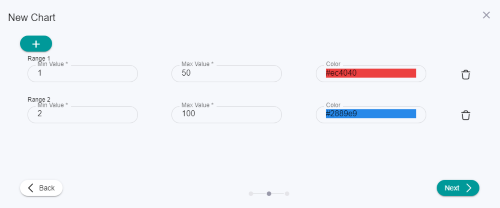
The following window opens for the "Gauge Chart":
-
Click the "+" icon to create a new value range.
-
Click in the Color input field to select a color.
-
Click on "Next".
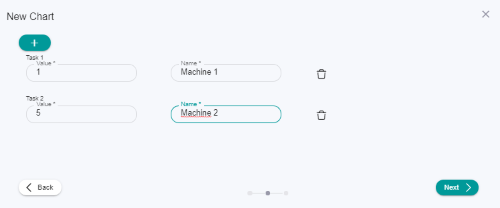
The following window opens for the "Gantt Chart":
-
Enter a value and a machine name.
-
Click the "+" icon to enter another value and machine name.
-
Click on "Next".
-
-
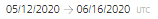
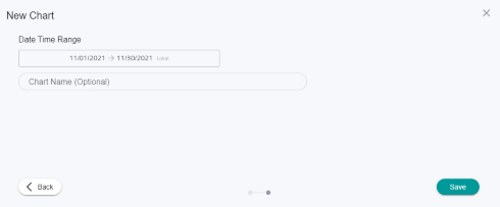
The "Date Time Range" window opens.
-
To open the calendar, click on the time range display.
-
Select a time period, and then click on "OK".
-
You can optionally enter a chart name in the "Chart Name" text box.
To return to the "My Dashboards" window, click on "Save" in the lower right part of the window.
-