Results
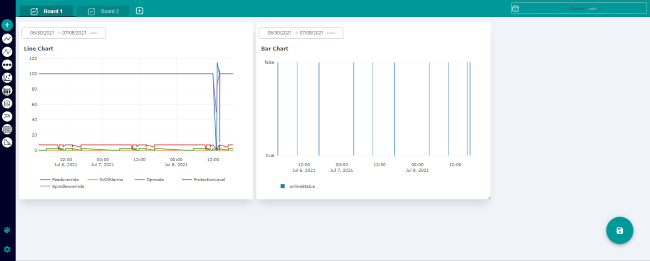
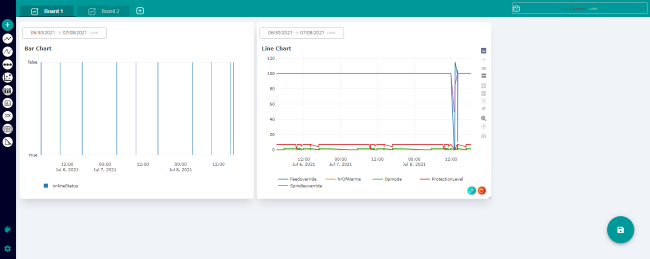
Setting the dashboard display
You can change the position, the size and the display area of the charts on the dashboard display.
Icons and buttons
|
Parameter |
Description |
|---|---|
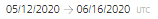 |
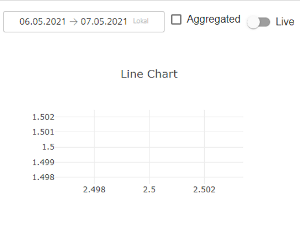
Displays the time range and the time zone used. Opens the calendar function. More information is provided in Chapter: Using the calendar function |
|
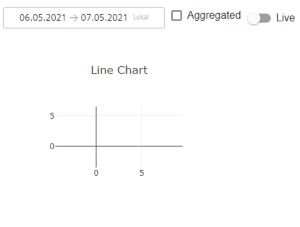
Aggregated |
Displays the aggregated data |
|
Live |
Displays the refreshed data starting at the time of activation. |
 |
Creates a snapshot in the "png" format. |
 |
Activates the "Zoom" function. |
 |
Activates the "Shift" of the display area function. |
 |
Zooms into the display area. |
 |
Zooms out of the display area. |
 |
Resets the complete display area |
 |
Resets the axis view |
 |
Switches over to a dotted line. |
 |
Displays the data when moving the mouse over the selected point in the diagram. |
 |
Compares the data when moving the mouse over the selected point in the diagram. |
 |
Connects to the plotly.com web page More information about third-party web pages is provided in Chapter: About this documentation. |
Procedure
Rearranging charts
-
Click on the chart that you wish to reposition on "My Dashboards".
-
Drag & drop it at the required position. You can arrange all charts in any sequence.
Changing the size of a chart
-
Click on the zoom magnifying glass icon in the chart menu bar.
-
Move the mouse to one edge of the chart until the mouse pointer changes to an arrow with two points.
-
Stretch the window to the required size
Changing the display area
-
To display the menu bar, move the mouse cursor over the chart.
-
Click on "+" icon to zoom into the display area.
- OR -
-
Press and hold the left mouse button, and use the mouse to zoom into the required display area.
-
Click on "-" in the bar to zoom out of the display area.
- OR -
-
Press and hold the left mouse button, and use the mouse to zoom out of the required display area.
-