Results
Displaying machine alarms
The following data relating to alarms is displayed in the "Machine Alarms" window:
-
Occurrence
-
Duration
-
List:
-
ID - alarm ID
-
Service life
-
Duration
-
End time
-
-
Alarm Filtering
-
Alarm number
-
Alarm range
-
Further, you can display alarms in various views:
-
In a bar chart
-
In a pie chart
Button / parameter
|
Button/parameter |
Description |
|---|---|
 |
Displays the pending alarms:
|
 |
You update the data that is located in the time interval by pressing the "Refresh" button. |
 |
Displays the time range and the time zone in which alarms are captured. A calendar opens when if you click on the button. More information is provided in Chapter: Using the calendar function. |
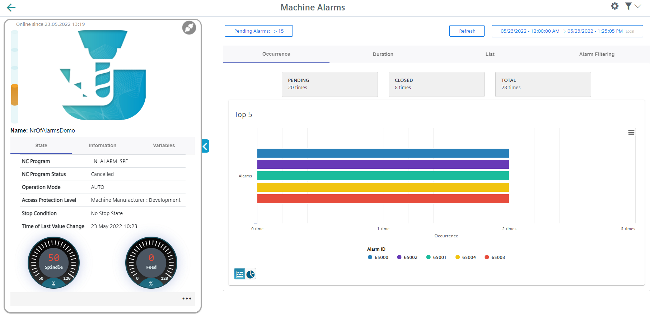
Occurrence
|
Alarm display |
Description |
|---|---|
|
Occurrence |
Displays how often the alarm has occurred in the selected time interval. All alarms have different alarm identifiers - the alarm ID. The alarms are displayed with different colors. How often the alarm has occurred is shown as a percentage in the pie chart. If you move the mouse over the bar of the corresponding alarm, a tooltip is displayed indicating how often the alarm has occurred. |
|
ACTIVE |
Displays the number of active alarms. |
|
CLOSED |
Displays the number of closed alarms. |
|
TOTAL |
Displays the number of all alarms. |
Procedure
-
In the "Information" area, click on the button with dots.
-
Click on "Alarms".
The "Machine alarms" window opens. -
The machine description is shown in the left-hand section of the window.
-
Select a specific time period using the calendar function.
-
Click on "Apply".
-
Open the "Occurrence" tab.
-
The alarms are shown in a bar chart where you can see how often the alarms have occurred.
-
To collapse the machine information, click on the left-pointing arrow symbol on the right side of the frame.
The bar chart is displayed in the full-screen mode.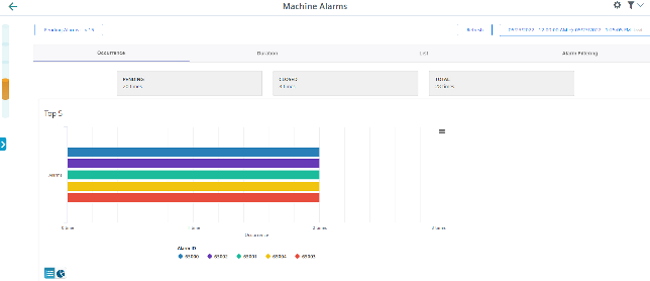
-
Click on the "Pie chart" icon to change the display type.
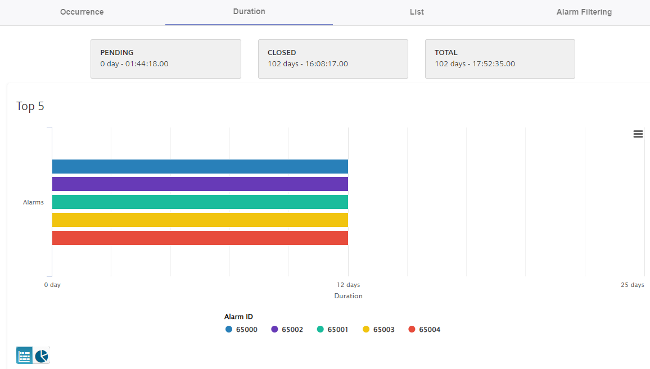
Duration
|
Alarm display |
Description |
|---|---|
|
Duration |
Displays the duration of the alarms within the defined time period in a chart. The alarms are displayed with different colors. The duration of the alarm is specified as a percentage. The alarm identifier - the alarm ID - is displayed below the diagram. If you move the mouse over the bar of the corresponding alarm, a tooltip is displayed, indicating the duration in days, hours, minutes and seconds. |
|
PENDING |
Displays the duration of active alarms in days and time. |
|
CLOSED |
Displays the duration of closed alarms in days and time. |
|
TOTAL |
Displays the total duration of all alarms in days and time. |
Procedure
-
Select a certain time period using the calendar function.
-
Click on "Apply".
-
Open tab "Duration".
-
The alarms are displayed in a bar chart where you can see the duration of the alarms.
-
Click on the "Pie chart" icon to change the display type.
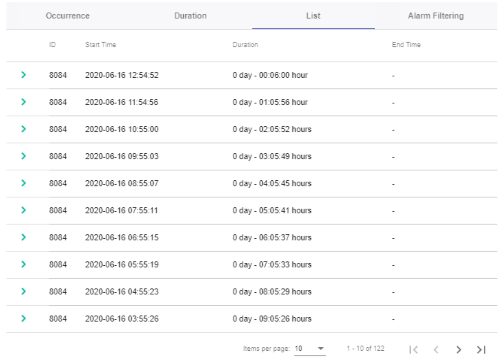
List
|
Parameter |
Description |
|---|---|
|
ID |
Displays the alarm identifier. |
|
Start time |
Shows the start time with the date (YYYY-MM-DD) and time (hh:mm:ss) |
|
Duration |
Displays the duration in days and time (hh:mm:ss) |
|
End time |
Shows the start time with the date (YYYY-MM-DD) and time (hh:mm:ss) |
 |
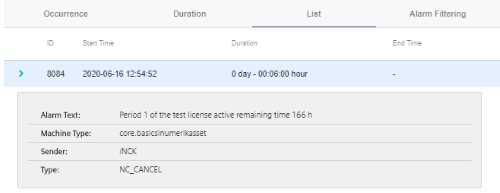
You can obtain more alarm information using the icon:
|
|
Buttons in the lower section of the window |
|
|
Item per page |
From the drop-down list, select how many alarms should be displayed on one page:
|
|
x - y of xy |
Displays how many pages there are, with the corresponding number of alarms per page. |
 |
The first page is displayed. |
 |
The previous page is displayed. |
 |
The next page is displayed. |
 |
The last page is displayed. |
Procedure
-
Select a certain time period using the calendar function.
-
Open tab "List".
-
The alarms are listed in a structured table form.
-
Select an alarm from the list and click on icon ">".
-
A menu opens and you can see more information about the alarm.
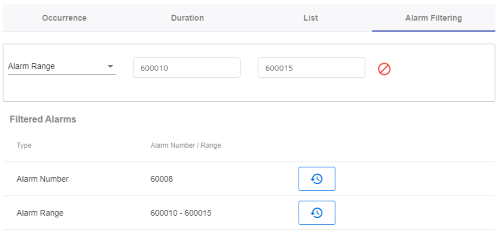
Alarm Filtering
|
Alarm display |
Description |
|---|---|
|
Type |
Select the alarm number or the alarm range from the drop-down list. In the overview you can alphabetically sort the alarm type (either in ascending or descending alphabetical order). |
|
Alarm number/area |
Enter the alarm number or the alarm range in the input field. In the overview, you can numerically sort the alarms (either in ascending or descending numerical order). |
 |
Selected alarms are no longer saved in MindSphere. The alarms are displayed in the overview. |
 |
Individually removing alarms or alarm ranges from the overview. |
Procedure
-
Open tab "Alarm Filtering".
-
Select "Alarm Number" or "Alarm Range" from the drop-down list.
-
Enter the required alarms in the input field and click on the "Do not save" icon.
NOTE
5 alarms that occur most frequently are displayed.