Results
- SIMATIC Energy Manager V1.17
- Preface
- What's new?
- Get to know Energy Manager
- Configuring the Energy Manager
- Adapting the app
- Configuring types
- Setting parameters
- Parameters in the Energy Manager
- Displaying a parameter list
- Displaying current values of a parameter
- Editing settings for variables
- Editing settings for KPI instances
- Saving the values of a KPI in a variable
- "Activate notifications" for variables with numerical data type and KPI instances
- "Activate notifications" for variables of the data type "Bool" and "String"
- "Counter" acquisition category
- Aggregation functions
- Managing energy data
- Operation
- Displaying the energy media analysis
- Configuring multivariable regression
- Evaluating the production of individual batches
- Creating user-defined dashboards
- Creating a dashboard
- Structure of the dashboards
- Creating widgets
- Introduction to widgets
- Create a widget
- Visualizing correlations (Diagram)
- Visualizing values (Value)
- Visualizing machine statuses (Gantt)
- Visualizing the violation of limit values (gauge)
- Visualizing the distribution of consumptions or quantities (Pie chart)
- Visualizing the intensity of data values (Heatmap)
- Visualizing relationships in 3D (3D bars)
- Visualizing energy flows (Sankey)
- Visualizing a chart sorted by size (Duration curve)
- Linking an image for presentation
- Preview a widget
- Working with widgets
- Widget views
- Adapting a user-defined dashboard
- Exporting and importing dashboards
- Analyzing data
- Create reports
- Quality codes
- Appendix
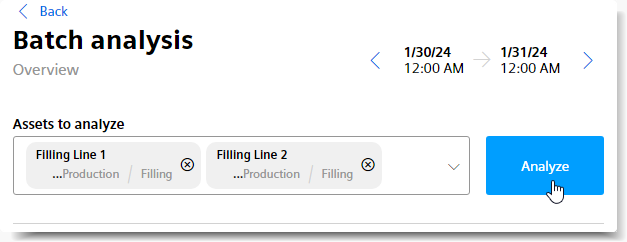
Analyzing multiple assets
You can compare the production of multiple assets by merging and consolidating the analyses.
Procedure
-
Click "Analysis" in the navigation bar.
-
Click "Batch analysis".
-
Select the period for the analysis.
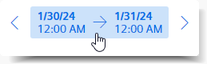
-
To display the dashboard for an asset, select the asset in My Plant.
-
To display the analysis for multiple assets, select the assets under "Assets to analyze".
-
Click "Analyze".
-
You can filter the display by parameters, batches, and materials.
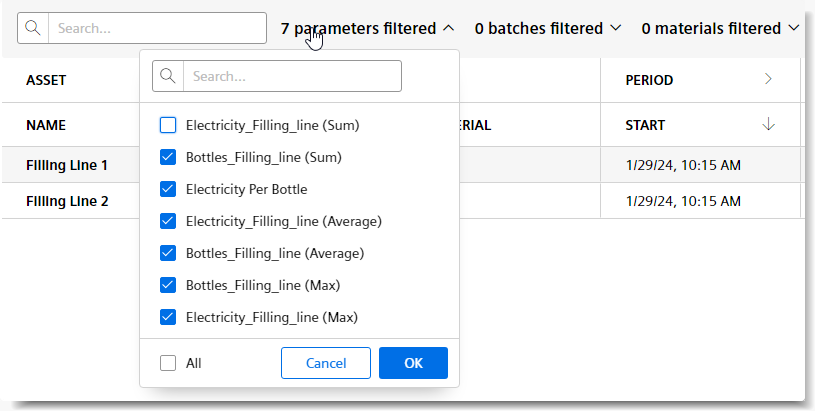
-
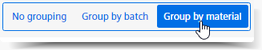
Group the display by batches or material.
-
To sort the display by a column, click in the column header.
-
To display more information on assets or periods, select
 in the column header.
NOTE
If the parameter basis was formed by dividing, e.g. for KPIs, the average of the values is displayed.
If the parameter represents a simple value, e.g. "filled bottles", the sum of the values is displayed.
Chap. 5.3.4
NOTE
Up to 10 assets can be selected.