Results
- SIMATIC Energy Manager V1.17
- Preface
- What's new?
- Get to know Energy Manager
- Configuring the Energy Manager
- Adapting the app
- Configuring types
- Setting parameters
- Parameters in the Energy Manager
- Displaying a parameter list
- Displaying current values of a parameter
- Editing settings for variables
- Editing settings for KPI instances
- Saving the values of a KPI in a variable
- "Activate notifications" for variables with numerical data type and KPI instances
- "Activate notifications" for variables of the data type "Bool" and "String"
- "Counter" acquisition category
- Aggregation functions
- Managing energy data
- Operation
- Displaying the energy media analysis
- Configuring multivariable regression
- Evaluating the production of individual batches
- Creating user-defined dashboards
- Creating a dashboard
- Structure of the dashboards
- Creating widgets
- Introduction to widgets
- Create a widget
- Visualizing correlations (Diagram)
- Visualizing values (Value)
- Visualizing machine statuses (Gantt)
- Visualizing the violation of limit values (gauge)
- Visualizing the distribution of consumptions or quantities (Pie chart)
- Visualizing the intensity of data values (Heatmap)
- Visualizing relationships in 3D (3D bars)
- Visualizing energy flows (Sankey)
- Visualizing a chart sorted by size (Duration curve)
- Linking an image for presentation
- Preview a widget
- Working with widgets
- Widget views
- Adapting a user-defined dashboard
- Exporting and importing dashboards
- Analyzing data
- Create reports
- Quality codes
- Appendix
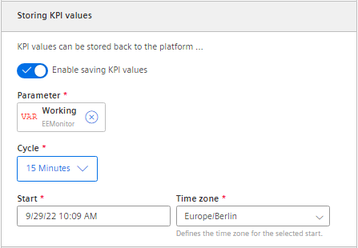
Saving the values of a KPI in a variable
The values of a KPI can be restored to a variable. The values are available for more calculations and visualizations even in other apps.
Saving KPI values
To save the values of a KPI in a variable, proceed as follows:
-
Open a KPI from the parameter list for editing.
-
Select the corresponding option in the "Saving KPI values" tab.
-
Select the variable in which the values are saved.
- or -
Create a new variable.
-
Select a cycle.
-
Select the start time at which saving should start.
-
To end saving of the KPI values, disable the option.
Creating a new variable for saving the KPI values
When you create a new variable, observe the following:
-
The variable must receive a unique name that has not yet been used.
-
The variable must be assigned to an aspect.
-
The variable is created in Asset Management.
-
Additional costs are incurred per variable. Note that aspects can be used multiple times.
Chap. 4.3.6