Results
- SIMATIC Energy Manager V1.17
- Preface
- What's new?
- Get to know Energy Manager
- Configuring the Energy Manager
- Adapting the app
- Configuring types
- Setting parameters
- Parameters in the Energy Manager
- Displaying a parameter list
- Displaying current values of a parameter
- Editing settings for variables
- Editing settings for KPI instances
- Saving the values of a KPI in a variable
- "Activate notifications" for variables with numerical data type and KPI instances
- "Activate notifications" for variables of the data type "Bool" and "String"
- "Counter" acquisition category
- Aggregation functions
- Managing energy data
- Operation
- Displaying the energy media analysis
- Configuring multivariable regression
- Evaluating the production of individual batches
- Creating user-defined dashboards
- Creating a dashboard
- Structure of the dashboards
- Creating widgets
- Introduction to widgets
- Create a widget
- Visualizing correlations (Diagram)
- Visualizing values (Value)
- Visualizing machine statuses (Gantt)
- Visualizing the violation of limit values (gauge)
- Visualizing the distribution of consumptions or quantities (Pie chart)
- Visualizing the intensity of data values (Heatmap)
- Visualizing relationships in 3D (3D bars)
- Visualizing energy flows (Sankey)
- Visualizing a chart sorted by size (Duration curve)
- Linking an image for presentation
- Preview a widget
- Working with widgets
- Widget views
- Adapting a user-defined dashboard
- Exporting and importing dashboards
- Analyzing data
- Create reports
- Quality codes
- Appendix
Creating a dashboard
In addition to the automatically generated dashboards, you can create user-defined dashboards. In the process, you choose between different widgets for data visualization. You design the dashboard according to your needs.
Procedure
To create a user-defined dashboard, follow these steps:
-
Select an asset in My Plant. The overview of the dashboards for the asset is displayed.
-
Click "Add dashboard" in the overview view.

-
Select "User-defined dashboard".
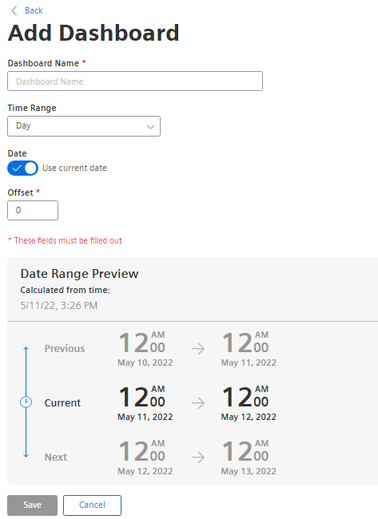
The "Add dashboard" view is displayed.
-
Enter a name for the dashboard.
-
Select the period for which the data will be visualized on the dashboard.
This period can be changed at a later date by the user.
-
To move the period, specify an "Offset".
-
Click "Save".
You have created a new, empty dashboard.
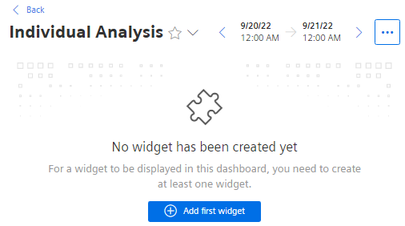
-
Create widgets at the dashboard.
You can find more information in the "Creating widgets" section.
Chap. 5.4.1