Results
Visualizing values (Value)
Description
The "Value" widget displays the aggregated value of a specific period. The value is derived either from a variable with a corresponding aggregation function or from a KPI result. The values of multiple parameters can be displayed in the widget.
The following views are available for the "Value" type:
Procedure
To define widget-specific display options, follow these steps:
-
Create a new widget or edit the existing one.
A parameter of the String type can be additionally selected, for example, to designate production sections in the "Diagram" detail view by a descriptive name. Only the aggregation "Last" type is available for parameters of String type.
-
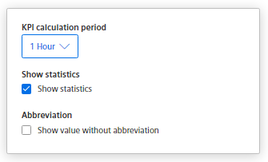
In step 3 "Details", you select whether the statistic is to be displayed.
To display the value with all digits and decimal places instead of the abbreviated representation of large values, select the option "Show values without abbreviation".
For KPI instances, specify the calculation period.
Result
The widget displays an individual value or multiple values.
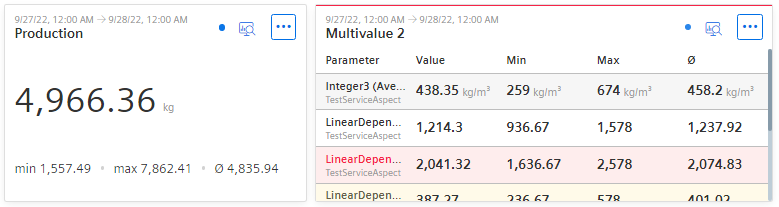
The value corresponding to the selected aggregation is displayed. In addition, the minimum, maximum and average for the selected period are displayed.
When displaying multiple values, the violation of the upper limit is visualized by colored highlighting.
NOTE
The displayed statistics is calculated from the calculated values in the cycle that is specified in the widget configuration.