Results
- SIMATIC Energy Manager V1.17
- Preface
- What's new?
- Get to know Energy Manager
- Configuring the Energy Manager
- Adapting the app
- Configuring types
- Setting parameters
- Parameters in the Energy Manager
- Displaying a parameter list
- Displaying current values of a parameter
- Editing settings for variables
- Editing settings for KPI instances
- Saving the values of a KPI in a variable
- "Activate notifications" for variables with numerical data type and KPI instances
- "Activate notifications" for variables of the data type "Bool" and "String"
- "Counter" acquisition category
- Aggregation functions
- Managing energy data
- Operation
- Displaying the energy media analysis
- Configuring multivariable regression
- Evaluating the production of individual batches
- Creating user-defined dashboards
- Creating a dashboard
- Structure of the dashboards
- Creating widgets
- Introduction to widgets
- Create a widget
- Visualizing correlations (Diagram)
- Visualizing values (Value)
- Visualizing machine statuses (Gantt)
- Visualizing the violation of limit values (gauge)
- Visualizing the distribution of consumptions or quantities (Pie chart)
- Visualizing the intensity of data values (Heatmap)
- Visualizing relationships in 3D (3D bars)
- Visualizing energy flows (Sankey)
- Visualizing a chart sorted by size (Duration curve)
- Linking an image for presentation
- Preview a widget
- Working with widgets
- Widget views
- Adapting a user-defined dashboard
- Exporting and importing dashboards
- Analyzing data
- Create reports
- Quality codes
- Appendix
View report
Description
In the "Reports" view, both available and planned reports are displayed. You can see and download periodically generated and one-off reports.
If there are more than 500 reports in the app, the oldest reports are deleted.
Procedure
To display the overview of all reports, proceed as follows:
-
Select an asset in My Plant.
-
Click
 in the information panel next to the "Reports".
The overview of configurations is displayed. Under each configuration, you find reports which were planned and created based on the configuration.
-
To view the reports based on a configuration, click
 in the configuration display.
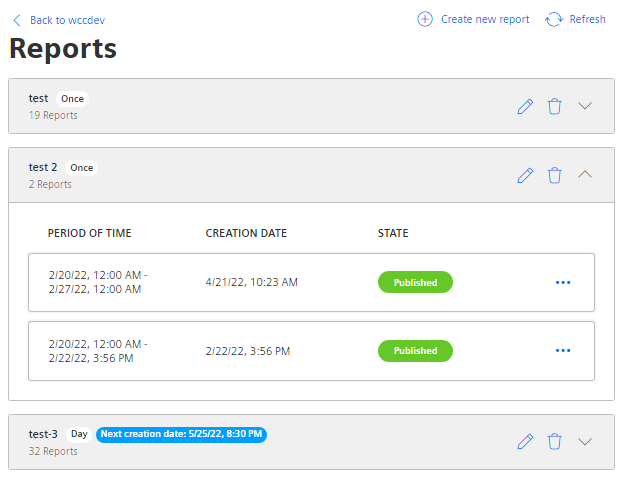
The view is expanded.
-
To download a report, click
 and from the drop-down menu select "Download"
  .
.
-
To create a report again after an error has occurred, select "Regenerate"
 in the row of the report.
-
To delete a report, select the report and click "Delete"
 .
.
This way you delete the report and not the configuration.
Chap. 5.6.4