Results
- SIMATIC Energy Manager V1.17
- Preface
- What's new?
- Get to know Energy Manager
- Configuring the Energy Manager
- Adapting the app
- Configuring types
- Setting parameters
- Parameters in the Energy Manager
- Displaying a parameter list
- Displaying current values of a parameter
- Editing settings for variables
- Editing settings for KPI instances
- Saving the values of a KPI in a variable
- "Activate notifications" for variables with numerical data type and KPI instances
- "Activate notifications" for variables of the data type "Bool" and "String"
- "Counter" acquisition category
- Aggregation functions
- Managing energy data
- Operation
- Displaying the energy media analysis
- Configuring multivariable regression
- Evaluating the production of individual batches
- Creating user-defined dashboards
- Creating a dashboard
- Structure of the dashboards
- Creating widgets
- Introduction to widgets
- Create a widget
- Visualizing correlations (Diagram)
- Visualizing values (Value)
- Visualizing machine statuses (Gantt)
- Visualizing the violation of limit values (gauge)
- Visualizing the distribution of consumptions or quantities (Pie chart)
- Visualizing the intensity of data values (Heatmap)
- Visualizing relationships in 3D (3D bars)
- Visualizing energy flows (Sankey)
- Visualizing a chart sorted by size (Duration curve)
- Linking an image for presentation
- Preview a widget
- Working with widgets
- Widget views
- Adapting a user-defined dashboard
- Exporting and importing dashboards
- Analyzing data
- Create reports
- Quality codes
- Appendix
Displaying the energy media analysis
Description
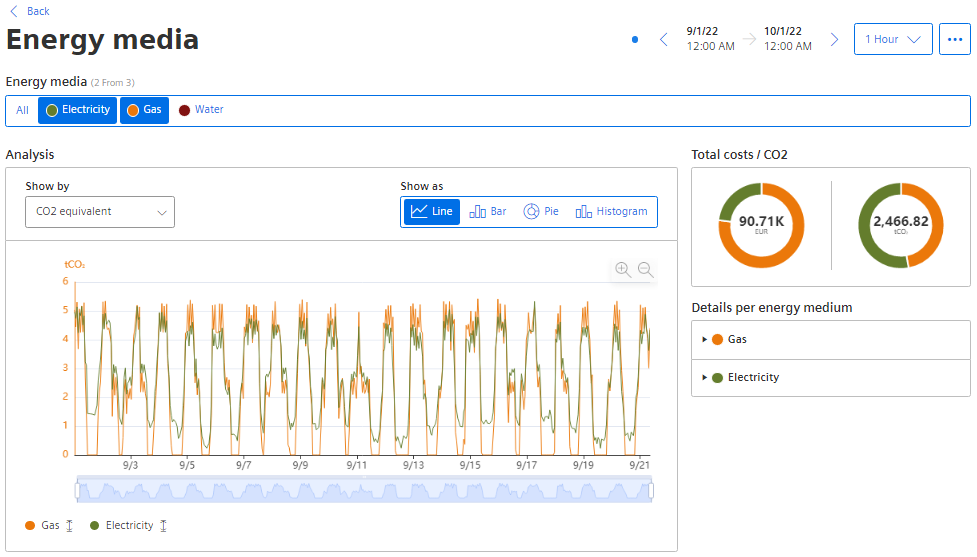
The energy media analysis is automatically displayed in the energy media dashboard.
As soon as you have assigned a reference value to an energy medium, you will not only see the total for consumption, costs and CO2 consumption but also the amount per unit, for example, per filled bottle.
Procedure
To display the energy media analysis, follow these steps:
-
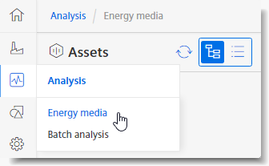
Go to "Analysis" and select "Energy media" in the navigation bar.
-
Select an asset for which the analysis is displayed.
By means of
 , you can switch the display of the asset structure between the tree and list view.
The energy media dashboard is displayed.
-
Have the information displayed for all or for each individual energy medium:

-
Have the data displayed as a line, bar, pie chart or histogram.

-
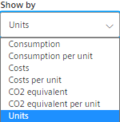
Select the criteria from the drop-down menu: Total consumption of the individual energy medium, Consumption per unit, Total costs, Costs per unit, Total CO2 equivalent, CO2 equivalent per unit, Units.
-
Result
The energy media analysis is displayed.
Chap. 5.1
NOTE
If the selected period for the dashboard or one of the widgets is in the future, the dashboard automatically updates every 30 seconds.