Results
- SIMATIC Energy Manager V1.17
- Preface
- What's new?
- Get to know Energy Manager
- Configuring the Energy Manager
- Adapting the app
- Configuring types
- Setting parameters
- Parameters in the Energy Manager
- Displaying a parameter list
- Displaying current values of a parameter
- Editing settings for variables
- Editing settings for KPI instances
- Saving the values of a KPI in a variable
- "Activate notifications" for variables with numerical data type and KPI instances
- "Activate notifications" for variables of the data type "Bool" and "String"
- "Counter" acquisition category
- Aggregation functions
- Managing energy data
- Operation
- Displaying the energy media analysis
- Configuring multivariable regression
- Evaluating the production of individual batches
- Creating user-defined dashboards
- Creating a dashboard
- Structure of the dashboards
- Creating widgets
- Introduction to widgets
- Create a widget
- Visualizing correlations (Diagram)
- Visualizing values (Value)
- Visualizing machine statuses (Gantt)
- Visualizing the violation of limit values (gauge)
- Visualizing the distribution of consumptions or quantities (Pie chart)
- Visualizing the intensity of data values (Heatmap)
- Visualizing relationships in 3D (3D bars)
- Visualizing energy flows (Sankey)
- Visualizing a chart sorted by size (Duration curve)
- Linking an image for presentation
- Preview a widget
- Working with widgets
- Widget views
- Adapting a user-defined dashboard
- Exporting and importing dashboards
- Analyzing data
- Create reports
- Quality codes
- Appendix
Configuring a batch analysis
Description
For each asset, you can create a dashboard for batch analysis. The dashboard is created automatically on the basis of the settings made by you.
Procedure
To configure batch analysis, proceed as follows:
-
Select an asset in My Plant.
-
Click "Add dashboard".
-
Select "Batch analysis".
The "Batch analysis configuration" view appears.
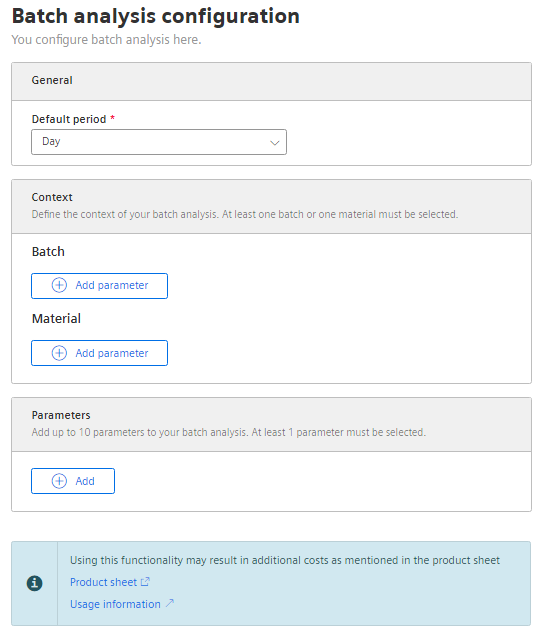
-
Select the default time period.
The periods defined under "Configuration" are available for selection.
-
Select the parameter that represents the batch.
This can be, for example, the batch number or a customer
-
Select the parameter that represents the material that will be produced.
If only one material is produced, this information can be omitted.
-
Select one or more parameters to be compared for individual batches.
The parameters can represent, for example, various cost factors (energy consumption, cost of raw materials) of production.
-
Click "Save".
An automatically generated dashboard is created and is continuously supplied with data.
The "Batch analysis" dashboard is displayed.
Chap. 5.3.1