Results
Configuring reports
Description
To create a report once or with periodic planning, define a configuration. You define the following in the configuration which is saved:
-
Report interval: One-off or planned
-
KPIs and variables that are reported
-
Type of aggregation: Balance value or process values
-
Placement of the values in a sheet of an Excel file
-
Recipients of the report
A report consists of one or multiple areas. For example, the values of a year can be shown in one area, while the daily values of the last month are shown in an additional area.
Procedure
To configure a report, follow these steps:
-
Go to My Plant and select an asset. The tiles of automatically generated and user-defined dashboards for this asset are displayed.
-
Click
 in the information panel next to the "Reports".
If a configuration has already been created, the overview is displayed.
-
To define a new configuration, select "Create new report configuration".
-
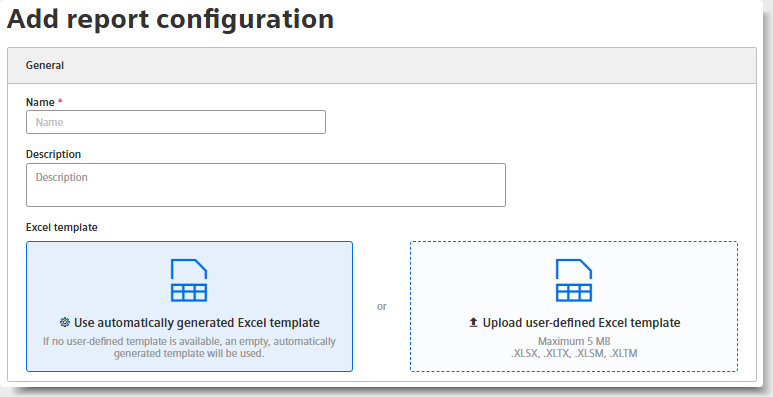
The "Add report configuration" editor appears.
-
Enter the name of the report.
The name is shown as the subject in the sent email and in the overview of the reports.
-
Optionally enter a description for the report.
The description makes it easier to assign the report.
-
Load an Excel file as a template for the report.
You can use either an automatically generated template or a user-defined Excel template.
User-defined Excel templateNOTE
There are no further restrictions when designing the template.
When selecting the start cell within a range, ensure that elements of your template are not overwritten.
The template can, for example, contain a letter head, or recurring information on the location of the plant for each report. You can structure a template using pre-formatted, filled cells as headings.
If you do not upload a template, a blank Excel file is used as the basis for the report. You can replace the automatically generated template with your own template at any time.
-
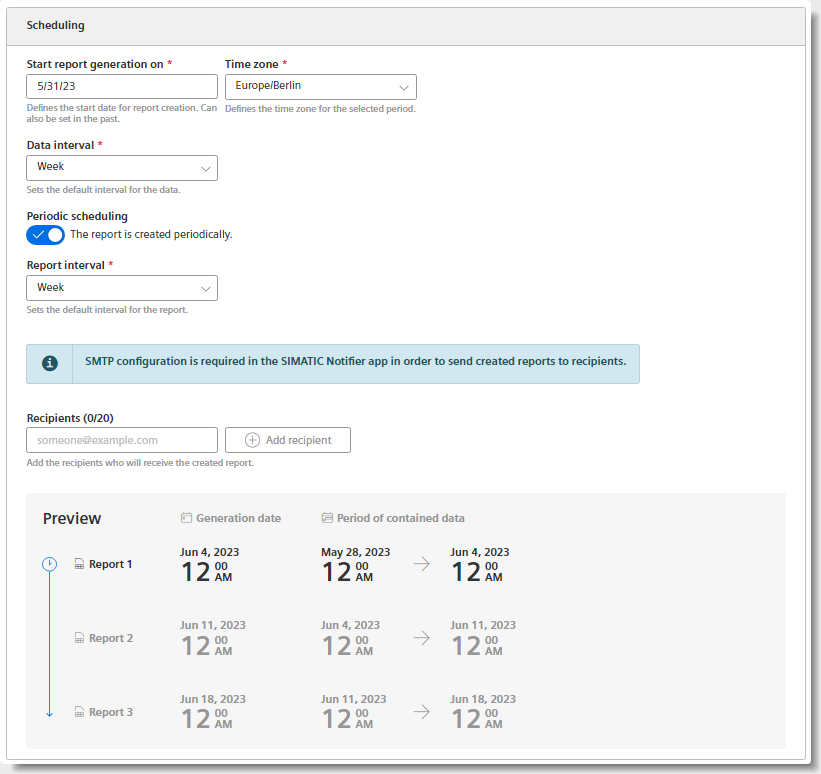
Select the date on which you want the report generation to start.
The date can lie in the past.
-
Select a time zone.
The time zone is added as an offset to the start date.
-
Select the "Data interval".
The report is generated for the first time when the interval after the start date is reached.
Example: The start date is 01/01/2022. The interval is one week. The report is generated on 7 Jan. 2022.
-
To create a configuration for a report that is generated regularly based on the selected interval, activate the "Periodic scheduling" switch.

To generate a one-off report, deactivate the switch.

-
Specify up to 20 valid email addresses for sending a periodical report by email.
 One-off reports
NOTE
One-off reports are not sent via email.
-
Enter the name of the first section.
Creating sectionsNOTE
You can create up to 20 sections with different configurations. The sections can be exported in different sheets of the Excel workbook.
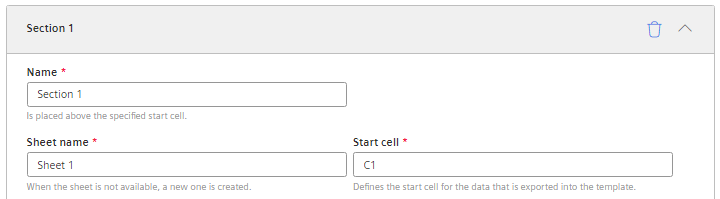
The name is specified together with the report interval in the start cell of the report. The values are listed below.
-
Specify the name of the Excel workbook in which the section is exported.
If a sheet with that name does not exist in the template, it is created.
-
Enter the start cell as of which the values are exported.
No check of the cell sectionsNOTE
There is no check as to whether the exported values will overwrite existing content.
-
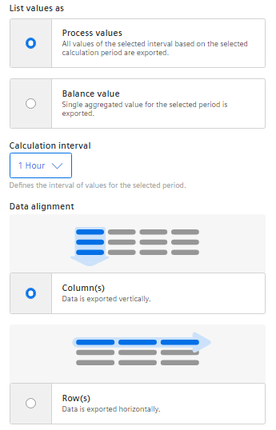
Select whether a balance value or process values are exported in this section.
-
Balance value: Single value that results from the aggregation of the interval values.
Example: The average value for one month.
-
Process values: All values that are available during the selected interval.
Example: A value is exported for each day of a month.
-
-
Only for process values, select the interval of the calculation. The interval specifies how often a process value is output within the reporting period.
Example: For the reporting period of one month, values are output every hour.
-
Select whether the data is arranged in columns or rows.
-
For new report configurations, add at least one parameter which is output in the area.
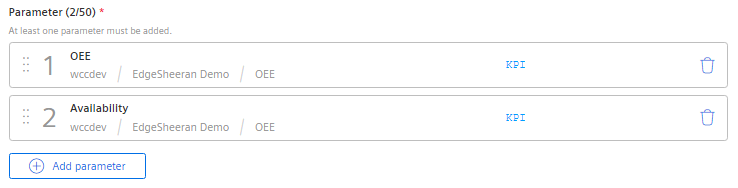
To change the sequence of the parameters, drag a parameter up or down by means of
 .
Parameter selection
.
Parameter selectionNOTE
Maximum number per section: 50 parameters.
Parameters of the String type are not supported.
Limited export to ExcelNOTE
In a report, you can export a maximum of 500,000 cells to Excel.
-
You can add another value at any time by clicking
 "Add parameter".
-
To create an additional section, select
"Add section".
-
To save the configuration, select "Save".
Result
-
The configuration for a report has been created and saved.
-
The "Reports" view is displayed.
-
The periodic reports are generated as of the start date with the selected interval. The one-time reports are only created for the start date.
NOTE
An Excel file is required to create the report.
Permitted data formats XLSX, XLTX, XLSM and XLTM
Minimum file size: 1 KB
Maximum file size: 5 MB