Results
Visualizing relationships in 3D (3D bars)
Description
Procedure
To define widget-specific display options, follow these steps:
-
Create a new widget or edit an existing one.
-
In step 2 "Parameters", select exactly 3 parameters whose relationship is to be visualized.
The values of the selected parameters must be available with the same time stamp.
-
In step 3 "Details", you define the KPI calculation period.
You assign a parameter to each axis.
You assign a name for each axis and determine the low limit and high limit.
You specify the color in which the different intensities are displayed.
Result
The values are visualized in different views.
3D bar
The selected parameters are visualized in the detail view of the widget.
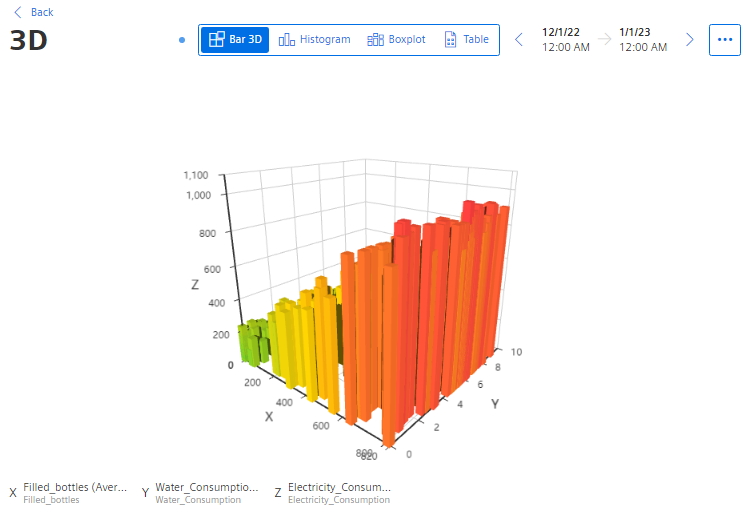
-
To rotate the view, hold down the mouse button and move the mouse pointer over the view.
-
To zoom in the view, use the mouse wheel.