Results
- SIMATIC Energy Manager V1.17
- Preface
- What's new?
- Get to know Energy Manager
- Configuring the Energy Manager
- Adapting the app
- Configuring types
- Setting parameters
- Parameters in the Energy Manager
- Displaying a parameter list
- Displaying current values of a parameter
- Editing settings for variables
- Editing settings for KPI instances
- Saving the values of a KPI in a variable
- "Activate notifications" for variables with numerical data type and KPI instances
- "Activate notifications" for variables of the data type "Bool" and "String"
- "Counter" acquisition category
- Aggregation functions
- Managing energy data
- Operation
- Displaying the energy media analysis
- Configuring multivariable regression
- Evaluating the production of individual batches
- Creating user-defined dashboards
- Creating a dashboard
- Structure of the dashboards
- Creating widgets
- Introduction to widgets
- Create a widget
- Visualizing correlations (Diagram)
- Visualizing values (Value)
- Visualizing machine statuses (Gantt)
- Visualizing the violation of limit values (gauge)
- Visualizing the distribution of consumptions or quantities (Pie chart)
- Visualizing the intensity of data values (Heatmap)
- Visualizing relationships in 3D (3D bars)
- Visualizing energy flows (Sankey)
- Visualizing a chart sorted by size (Duration curve)
- Linking an image for presentation
- Preview a widget
- Working with widgets
- Widget views
- Adapting a user-defined dashboard
- Exporting and importing dashboards
- Analyzing data
- Create reports
- Quality codes
- Appendix
Introduction to Reporting
Description
Reports are a central component of the app. Reports are generated to complement the visualization of KPIs and variables on the dashboards. The reports provide selected information on productivity, energy consumption and costs at regular intervals without the recipient of the reports having to have access to the app. You can also generate a one-off immediate report whose configuration is not saved.
Reports are configured individually. Reports are generated as an Excel spreadsheet. You can use a self-designed template.
Reports can be downloaded and sent automatically via email.
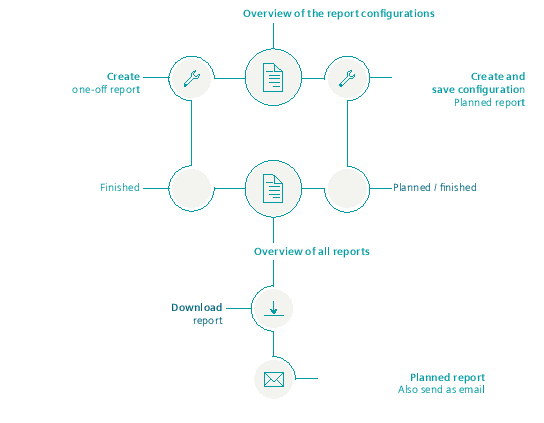
Procedure
To configure and generate reports, proceed as follows:
Chap. 5.6.1