Results
- SIMATIC Energy Manager V1.17
- Preface
- What's new?
- Get to know Energy Manager
- Configuring the Energy Manager
- Adapting the app
- Configuring types
- Setting parameters
- Parameters in the Energy Manager
- Displaying a parameter list
- Displaying current values of a parameter
- Editing settings for variables
- Editing settings for KPI instances
- Saving the values of a KPI in a variable
- "Activate notifications" for variables with numerical data type and KPI instances
- "Activate notifications" for variables of the data type "Bool" and "String"
- "Counter" acquisition category
- Aggregation functions
- Managing energy data
- Operation
- Displaying the energy media analysis
- Configuring multivariable regression
- Evaluating the production of individual batches
- Creating user-defined dashboards
- Creating a dashboard
- Structure of the dashboards
- Creating widgets
- Introduction to widgets
- Create a widget
- Visualizing correlations (Diagram)
- Visualizing values (Value)
- Visualizing machine statuses (Gantt)
- Visualizing the violation of limit values (gauge)
- Visualizing the distribution of consumptions or quantities (Pie chart)
- Visualizing the intensity of data values (Heatmap)
- Visualizing relationships in 3D (3D bars)
- Visualizing energy flows (Sankey)
- Visualizing a chart sorted by size (Duration curve)
- Linking an image for presentation
- Preview a widget
- Working with widgets
- Widget views
- Adapting a user-defined dashboard
- Exporting and importing dashboards
- Analyzing data
- Create reports
- Quality codes
- Appendix
What's new?
After you open the app for the first time, you will be welcomed with the display "What's new in the Energy Manager". The newly added features are presented here.
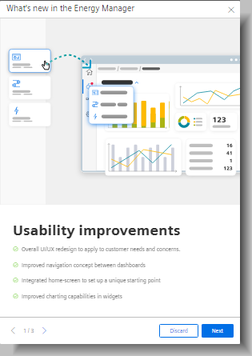
You can also call a presentation of the new features from the start page.
You can find the history of new features in all versions in the SiePortal.
Version V1.17
Analyses at a glance
The "Analysis" view shows the dashboards for energy media analyses and batch analyses at a glance.
Batch analysis for multiple assets
Batch analysis is now possible for a selection of multiple assets. This allows you to compare the data of different batches from different production lines.
More detailed usage information
The "Usage information" view shows in detail which assets are using which resources. A direct link to a resource upgrade is provided.
New view in the "Duration Curve" widget
The "Duration Curve" widget offers the new "Scatter plot" view.
More user friendly
The legend display in chart views of widgets is now more user friendly.
More units added to selection lists
Grams, kilograms, and tons per m3 are available as units for the CO2 equivalent in the contract information.
New links on the start page
Give us your feedback. You can find a direct link on the start page.
You can display the app documentation in HTML format directly from the start page.
Chap. 2