Results
Creating status mappings
Description
You use status mappings in a widget of the type "Gantt" to visualize different values by colors and labels.
Status mappings are available for all assets of My Plant.
Displaying a list of status mappings
To display available status mappings and create a new status mapping, click "Status mappings" in the "Configuration" view.
The list of available status mappings is displayed.
These status mappings are available for the creation of a widget of the type "Gantt".
Creating a status mapping
To create a status mapping, follow these steps:
-
Show the list of status mappings.
-
Click "Create new status mapping".
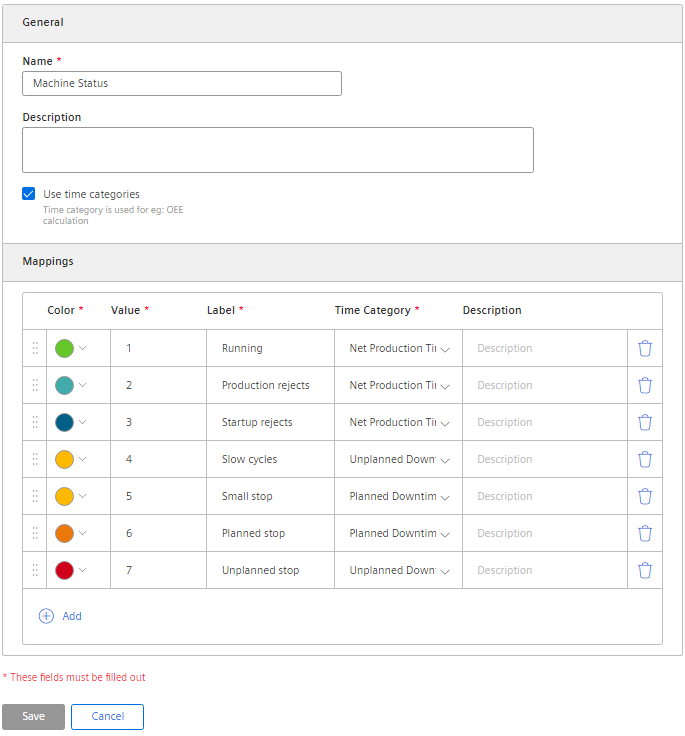
The "Add status mapping" editor is displayed.
-
Assign a unique name and optionally a description.
-
Select the "Use time categories" check box if you want to map the status mapping in connection with the calculation of the productivity of your plant (overall effectiveness of equipment) to a KPI instance.
-
You assign a color, a label, a time category and optionally a description for each value that a variable can assume. The label is displayed in the widget for the selected machine status.
If the parameter uses a value that is not defined in the "Status mapping" table, it is displayed with the status "Not defined" and the color white in the Gantt widget.
You use the created status mapping in connection with the "Gantt" widget. The order of the individual status mappings is reflected
in the Gantt widget as shown in the table. You can change the order by dragging the  icon.
icon.
Editing or deleting a status mapping
-
To edit an existing status mapping or delete it, click
 in the list of the status mappings.
-
Select "Edit" or "Delete".