Results
- MindSphere app SIMATIC Energy Manager V1.11
- Legal information
- What's new in Energy Manager?
- Introduction to the Energy Manager
- Configuring types
- Setting parameters
- Parameters in the Energy Manager
- Displaying a parameter list
- Displaying current values of a parameter
- Editing settings for variables
- Editing settings for KPI instances
- "Activate notifications" for variables with numerical data type and KPI instances
- "Activate notifications" for variables of the data type "Bool" and "String"
- "Counter" acquisition category
- Aggregation functions
- Managing energy data
- Configuring multivariable regression
- Evaluating the production of individual batches
- Creating user-defined dashboards
- Creating a dashboard
- Structure of the dashboards
- Creating widgets
- Introduction to widgets
- Create a widget
- Visualizing correlations (Diagram)
- Visualizing values (Value)
- Visualizing machine statuses (Gantt)
- Visualizing the violation of limit values (gauge)
- Visualizing the distribution of consumptions or quantities (Pie chart)
- Visualizing the intensity of data values (Heatmap)
- Visualizing energy flows (Sankey)
- Visualizing a chart sorted by size (Duration curve)
- Working with widgets
- Adapting a user-defined dashboard
- Create reports
- Appendix
Finding the analysis quickly
The app makes it easy for you to display existing analyses without time-consuming searches in My Plant.
After you have selected an analysis type in the navigation bar under "Analyses", the assets for which such an analysis already exists are displayed. For example, you can see all the step time analyses available for your plant.
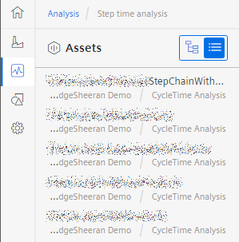
To view the dashboard with the analysis, select the asset in the filtered list or tree view. The dashboard is displayed.
Chap. 3.2.4