Results
Structure of the dashboards
Overview
The dashboards contain a graphical representation of variables or KPI types. Widgets are used for the graphical representation. A maximum of 5 dashboards can be created per asset within My Plant.
The figure below provides an overview of the structure of a dashboard:
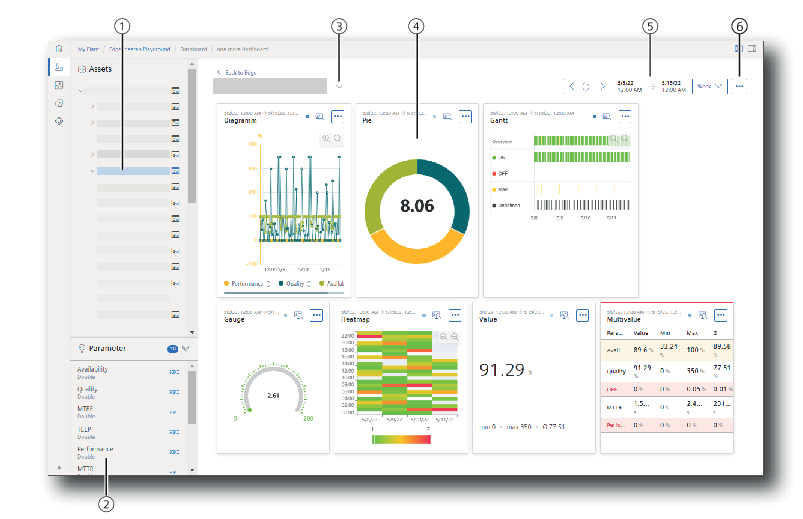
|
① |
My Plant |
|
② |
Parameter list: Switch to parameter visualization |
|
③ |
Dashboards |
|
④ |
Widgets: Visualization of KPIs or variables |
|
⑤ |
Period |
|
⑥ |
Editing dashboards and widgets |